





A Laravel Telescope-inspired dev toolbar and real-time server monitor for AdonisJS v6 & v7.
Drop a single Edge tag into your layout and get a live stats bar showing CPU, memory, requests/sec, database pool, Redis, queues, and logs -- plus a full debug toolbar with SQL query inspection, event tracing, route listing, live log tailing, and custom panels.
Zero frontend dependencies. Zero build step. Just @serverStats() and go.
Zero runtime dependencies. Everything this package needs at runtime is either built into Node or an optional peer dependency you already chose to install (@adonisjs/lucid, better-sqlite3, ...). Nothing extra lands in your production node_modules supply chain.
New (alpha): Native React & Vue components for Inertia.js apps — same features, framework-native.
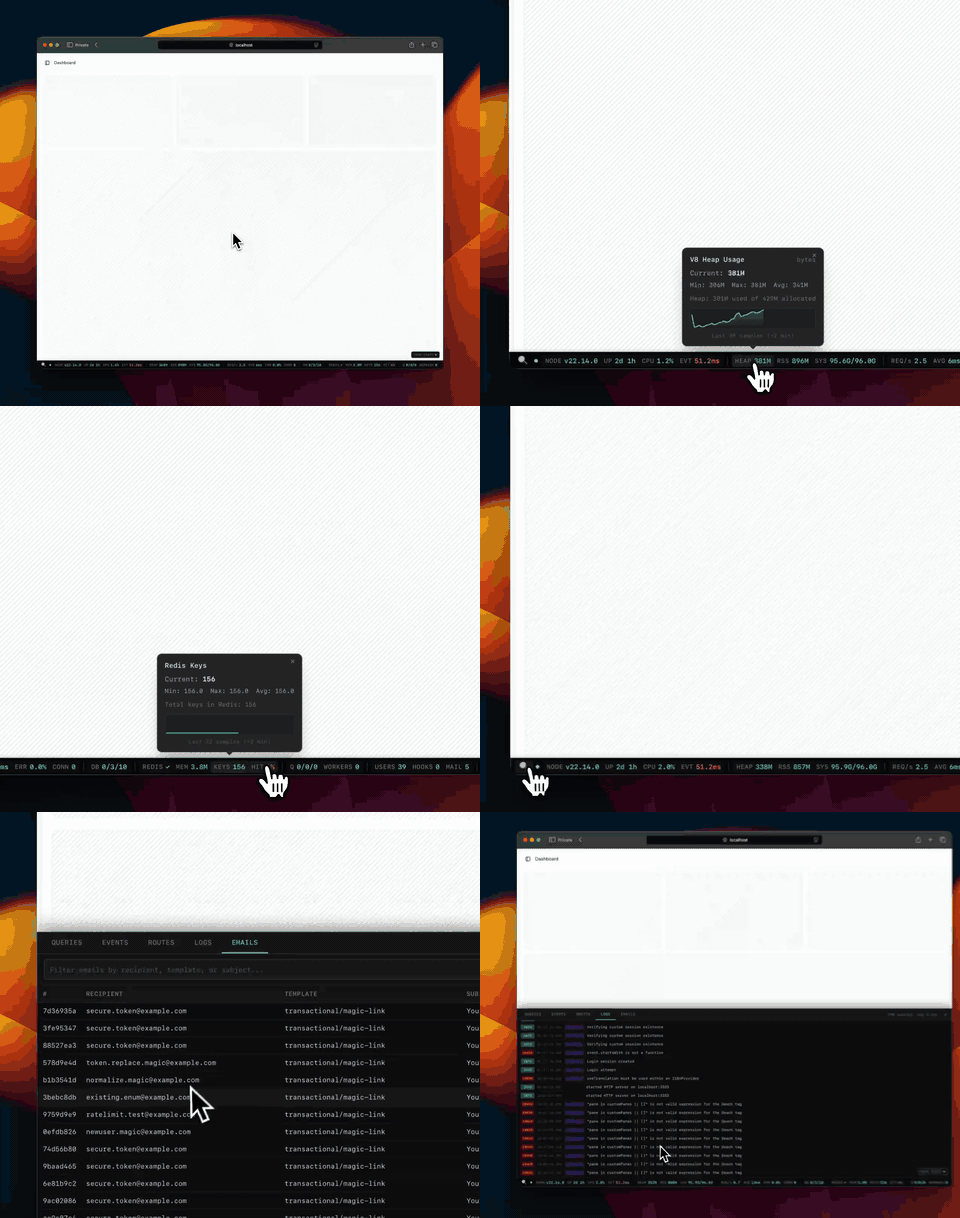
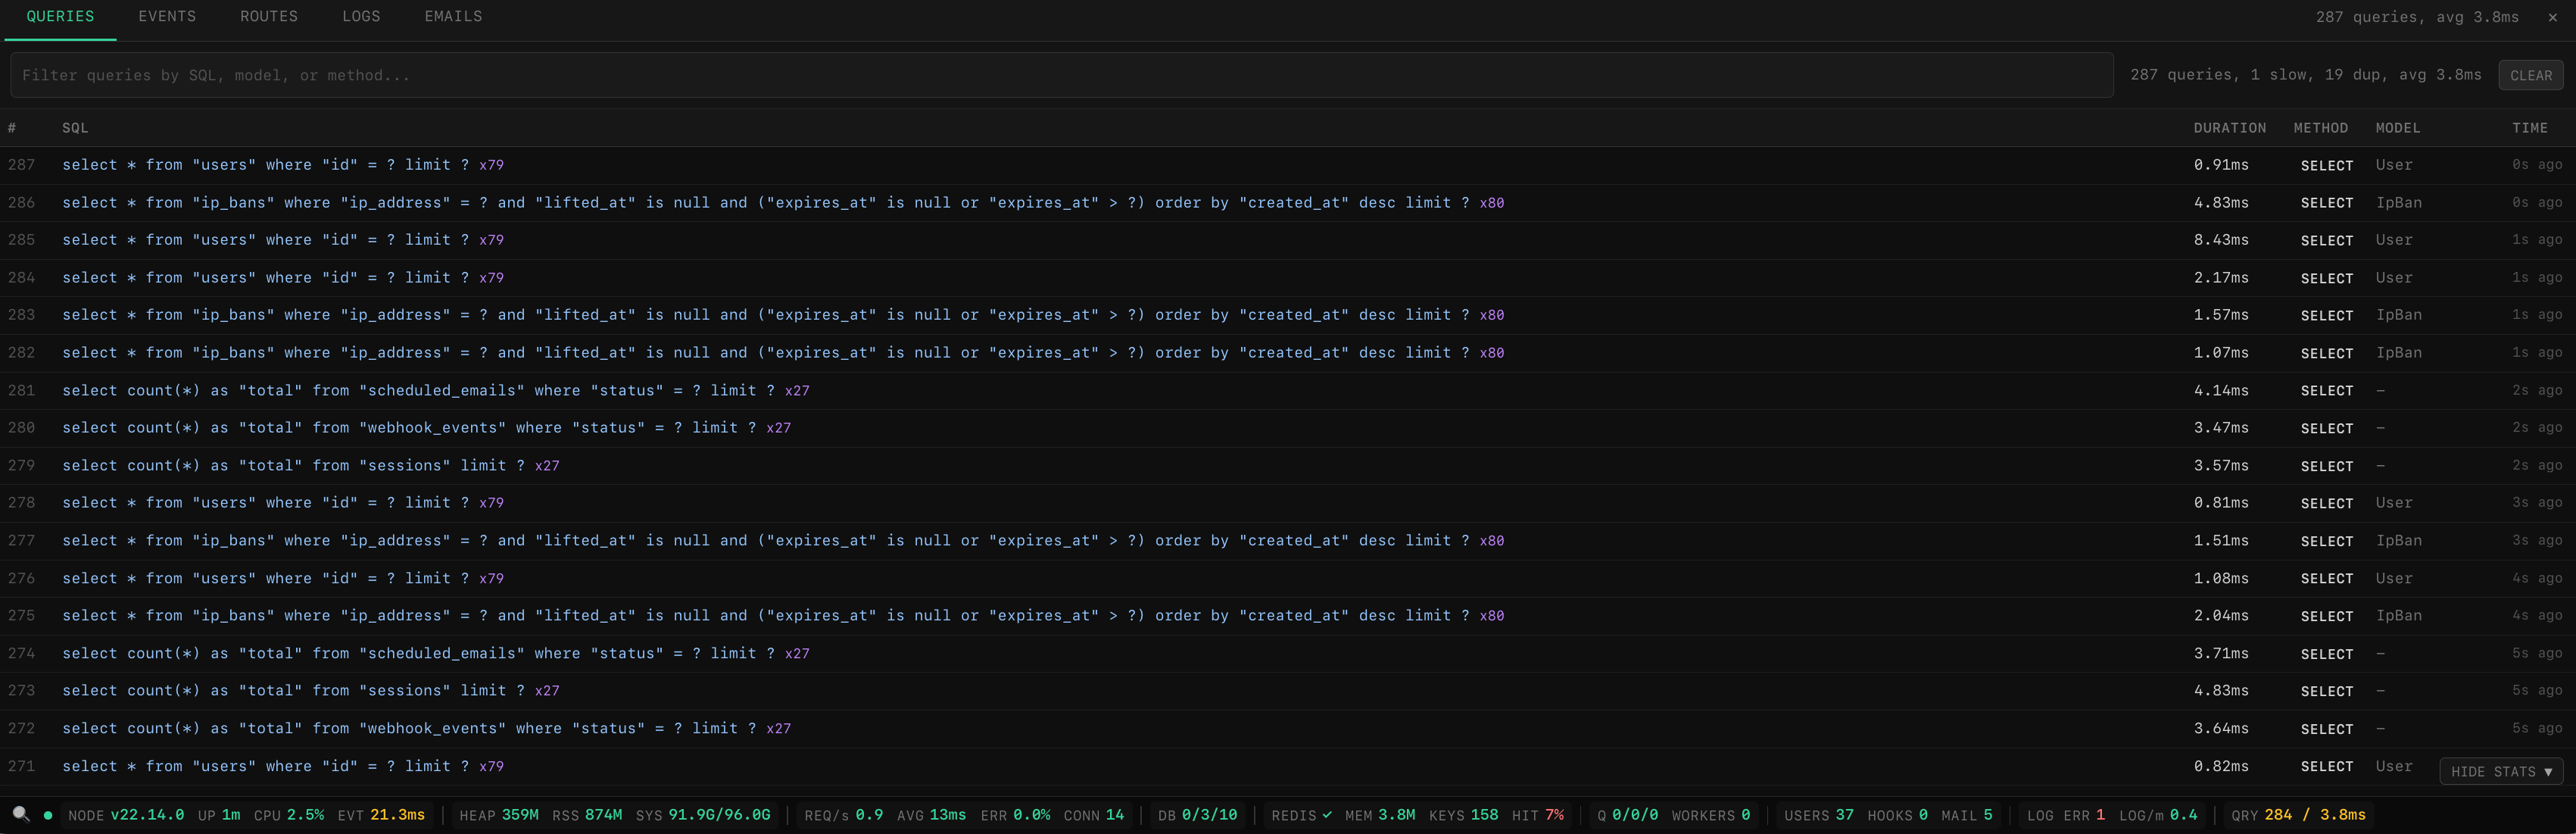
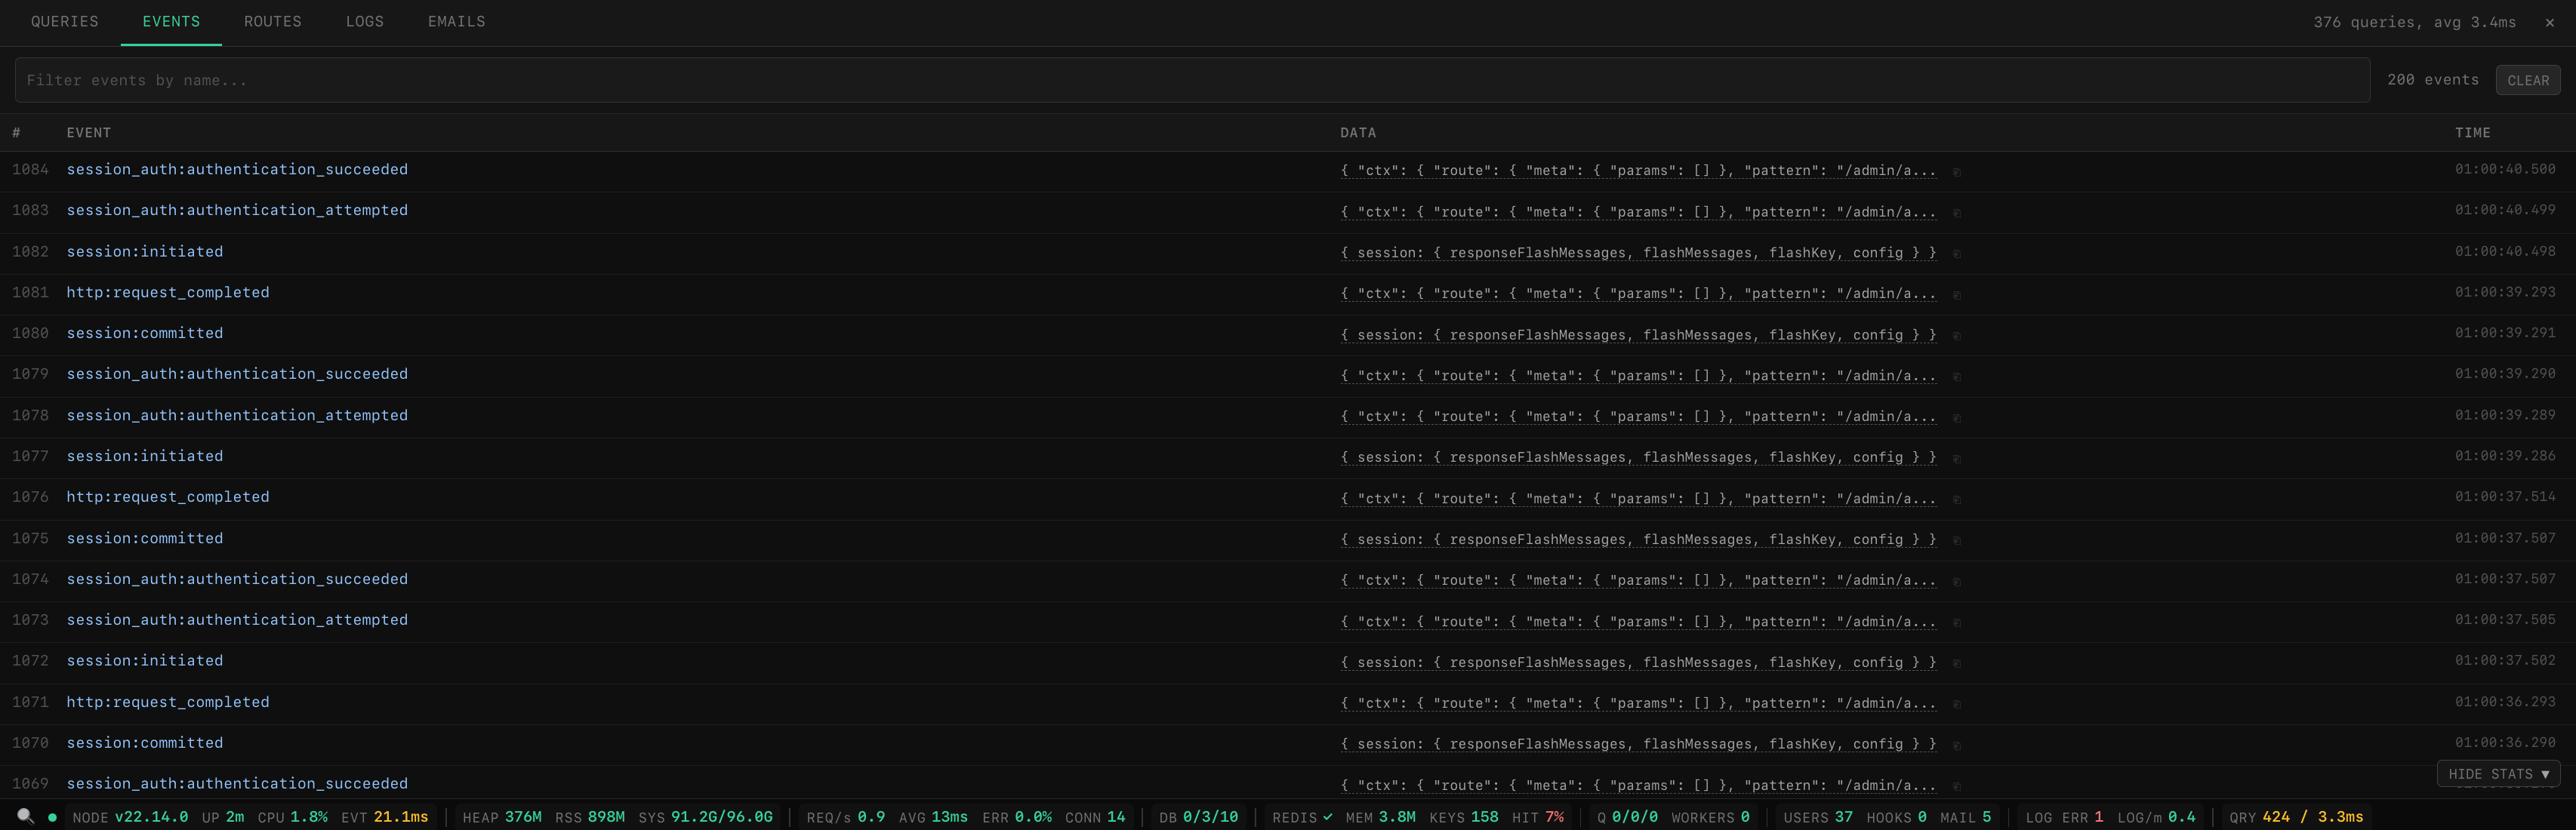
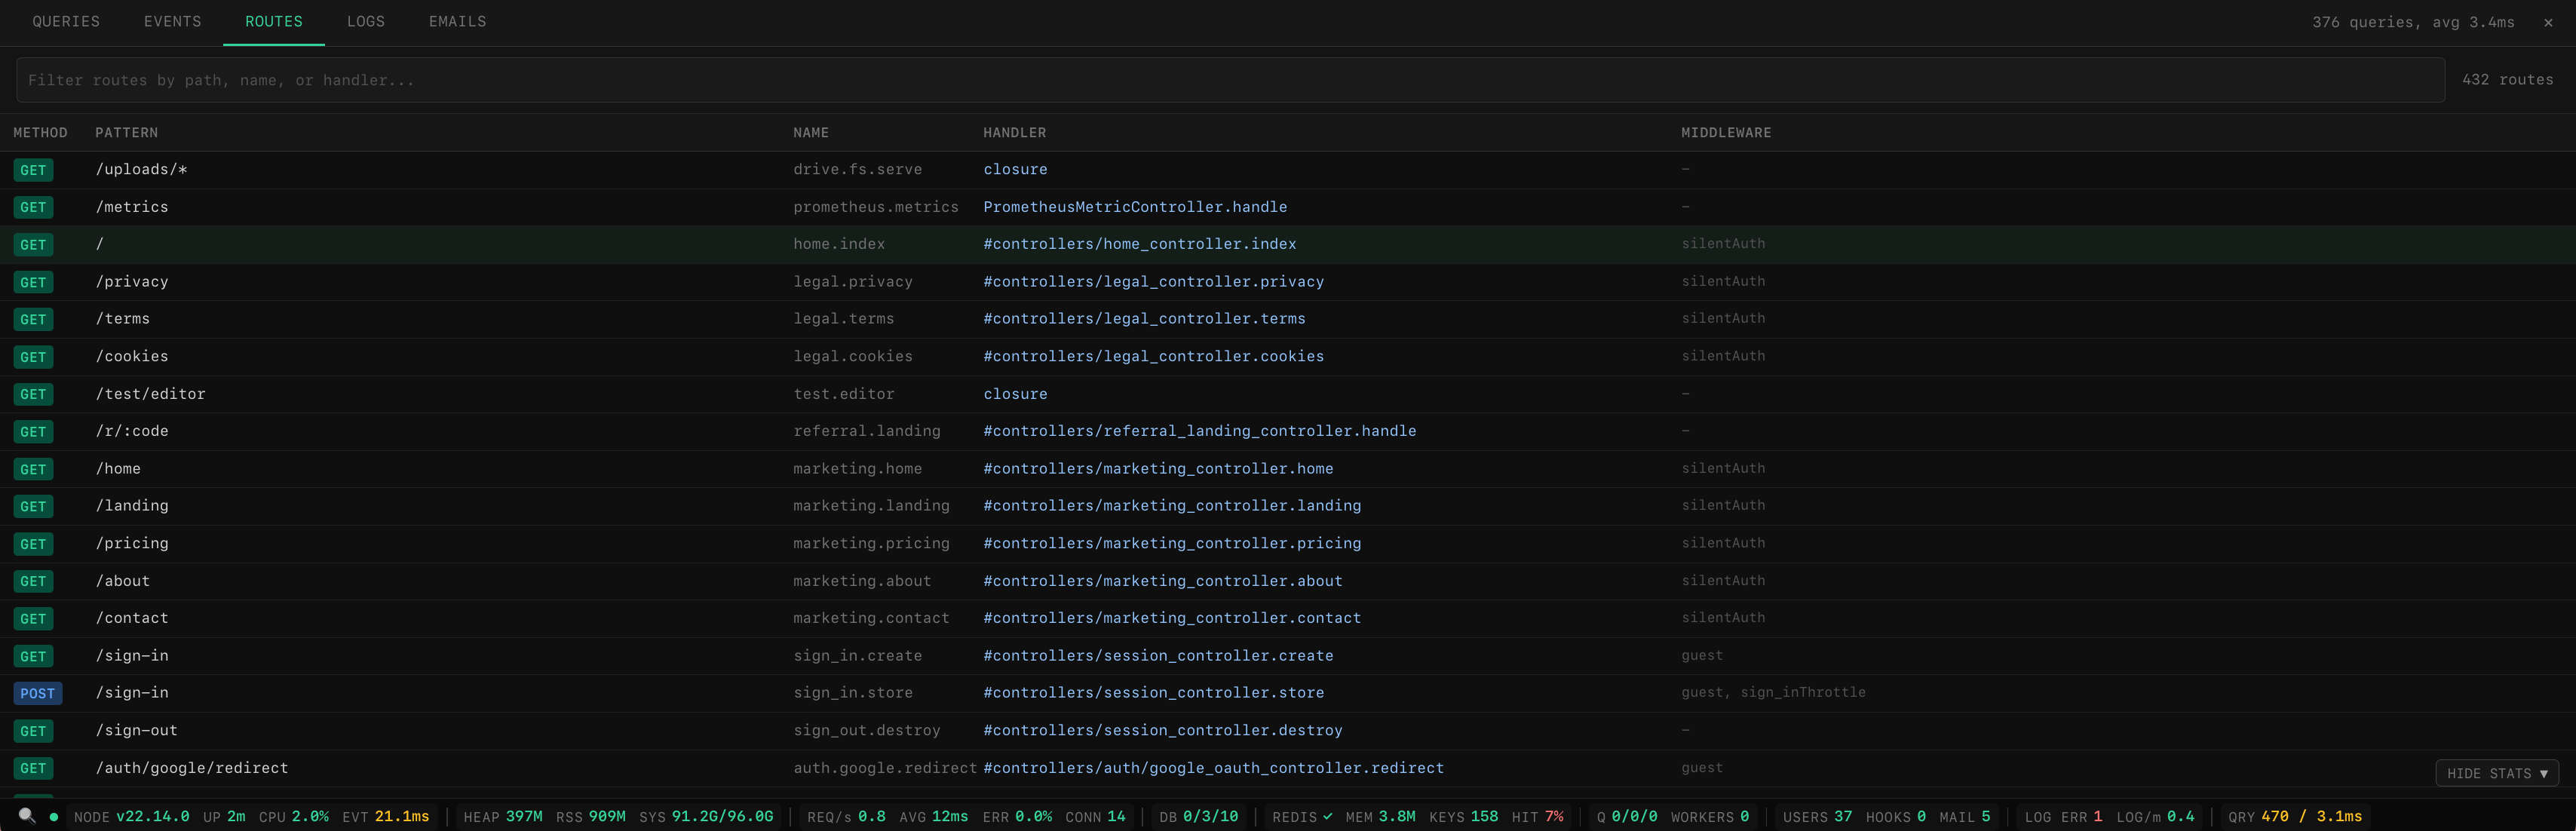
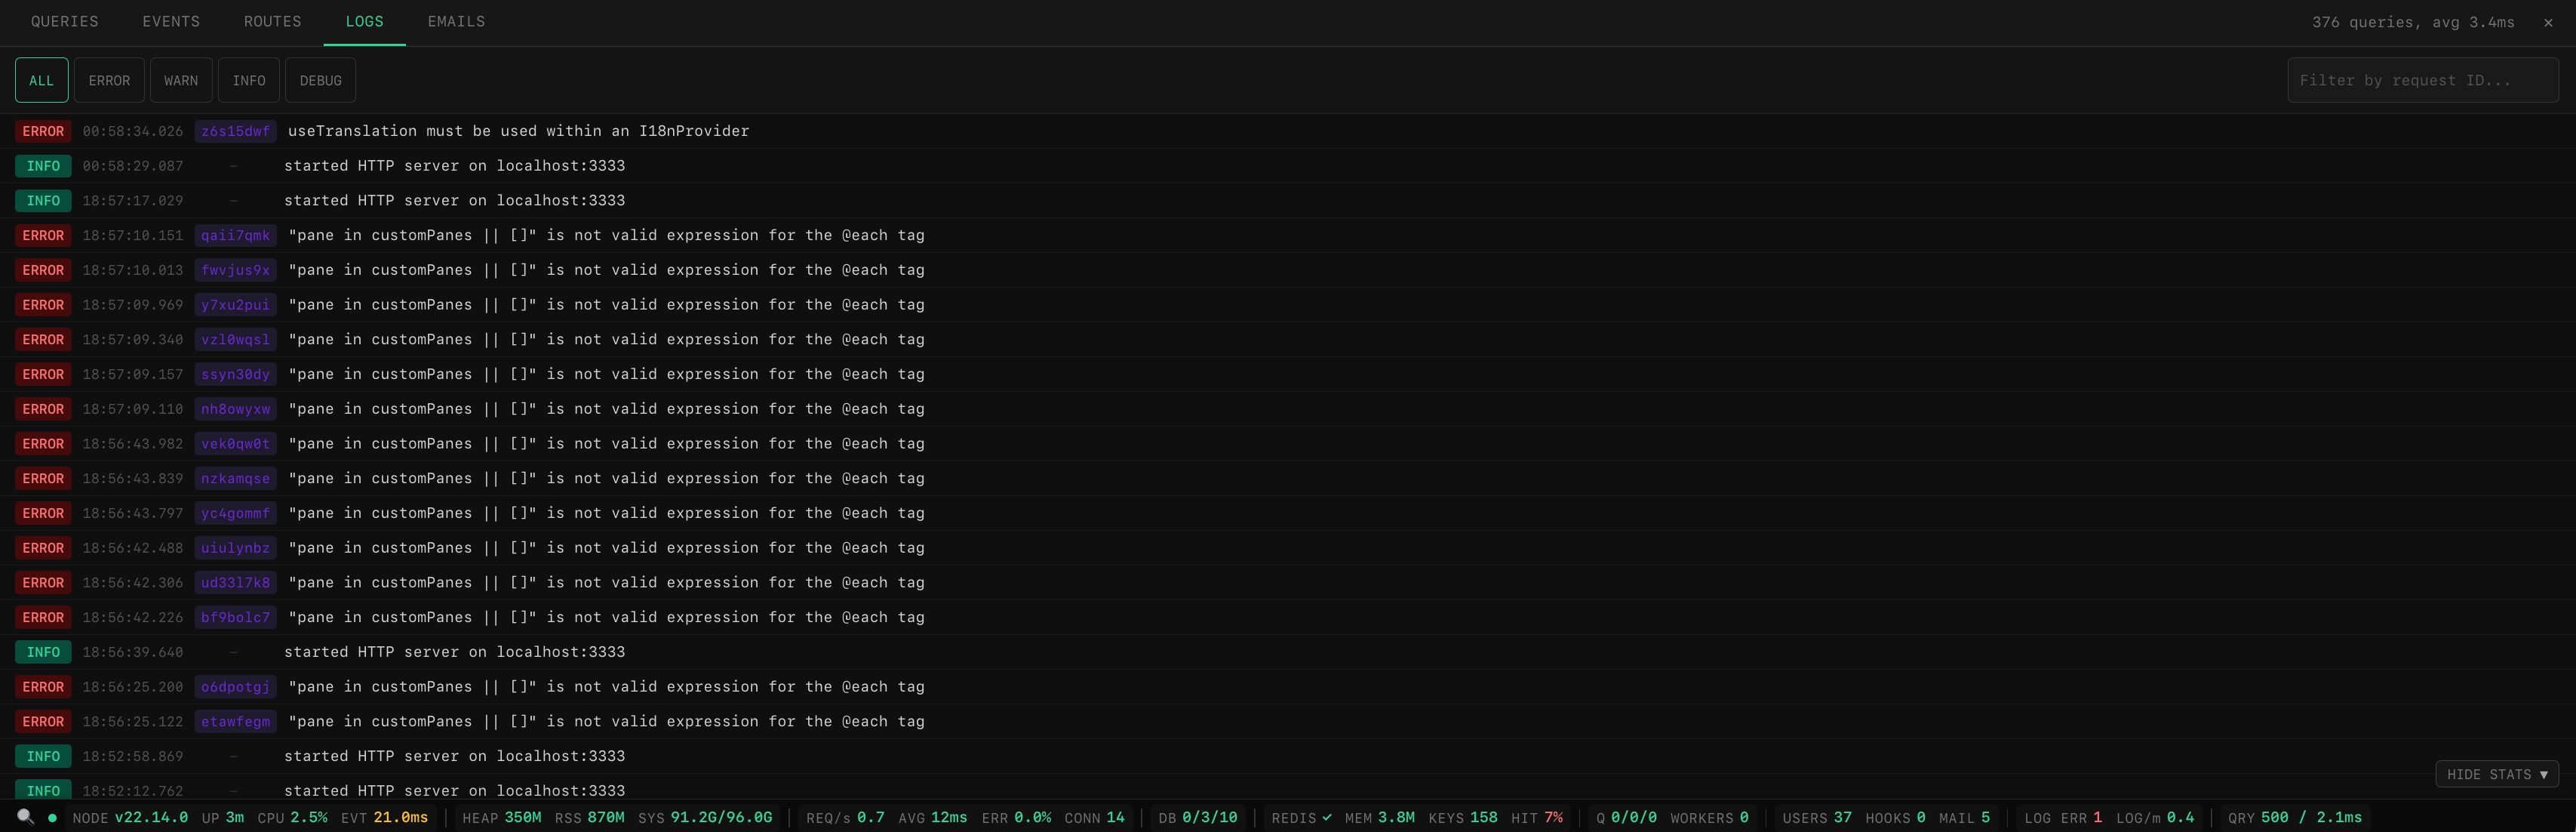
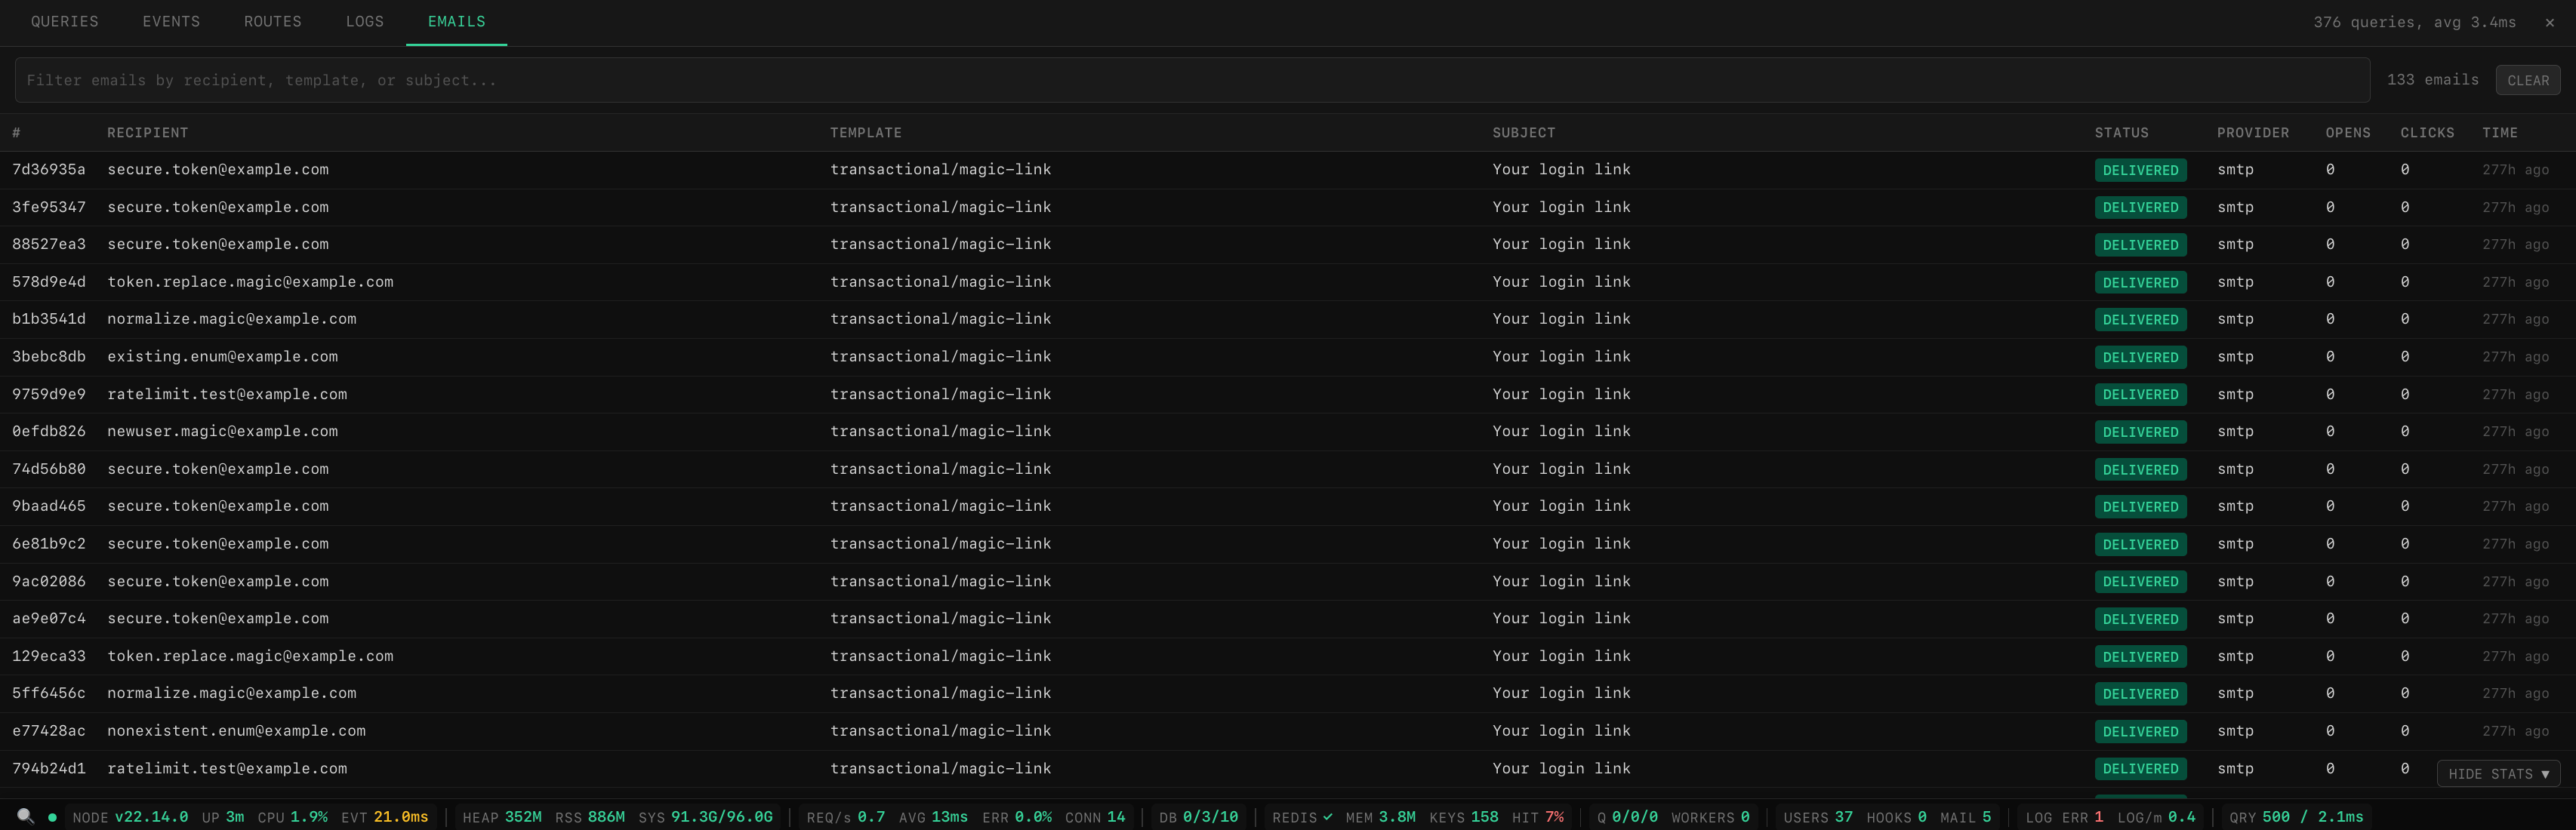
Debug toolbar -- expandable panels for deep inspection:
| Queries | Events |
|---|---|
 |
 |
| Routes | Logs |
|---|---|
 |
 |
| Emails (custom pane) |
|---|
 |
- Live stats bar -- CPU, memory, event loop lag, HTTP throughput, DB pool, Redis, queues, logs
- Debug toolbar -- SQL queries, events, emails, routes, logs with search and filtering
- Request tracing -- per-request waterfall timeline showing DB queries, events, and custom spans
- Custom panes -- add your own tabs (webhooks, emails, cache, anything) with a simple config
- Full-page dashboard -- dedicated page at
/__statswith overview cards, charts, request history, query analysis, EXPLAIN plans, cache/queue/config inspection, and saved filters - Pluggable collectors -- use built-in collectors or write your own
- Visibility control -- show only to admins, specific roles, or in dev mode
- SSE broadcasting -- real-time updates via AdonisJS Transmit
- Prometheus export -- expose all metrics as Prometheus gauges
- Self-contained -- inline HTML/CSS/JS Edge tag, no external assets
- React & Vue support (alpha) -- native Inertia.js components with the same features as Edge
- Graceful degradation -- missing optional dependencies are handled automatically
- Theme support -- dark and light themes across dashboard, debug panel, and stats bar with system preference detection and manual toggle
npm install adonisjs-server-stats// adonisrc.ts
providers: [
() => import('adonisjs-server-stats/provider'),
]// start/kernel.ts
server.use([() => import('adonisjs-server-stats/middleware')])// config/server_stats.ts
import { defineConfig } from 'adonisjs-server-stats'
export default defineConfig({})That's it -- zero config required. Collectors are auto-detected from your installed packages (Lucid, Redis, BullMQ, etc.) and enabled automatically. All other options have sensible defaults.
Common setup -- add access control and enable the toolbar/dashboard:
// config/server_stats.ts
import { defineConfig } from 'adonisjs-server-stats'

export default defineConfig({
  authorize: (ctx) => ctx.auth?.user?.role === 'admin',
  toolbar: true,
  dashboard: true,
})
Tip: Enable query capture -- Lucid only emits
db:queryevents whendebug: trueis set on the connection. Without it, the Queries panel will be empty.// config/database.ts connections: { postgres: { client: 'pg', debug: app.inDev, // ← enables query capture in development connection: { ... }, }, }
Full control -- override auto-detection with explicit collectors:
// config/server_stats.ts
import env from '#start/env'
import { defineConfig } from 'adonisjs-server-stats'
import {
  processCollector,
  systemCollector,
  httpCollector,
  dbPoolCollector,
  redisCollector,
  queueCollector,
  logCollector,
  appCollector,
} from 'adonisjs-server-stats/collectors'

export default defineConfig({
  pollInterval: 3000,
  collectors: [
    processCollector(),
    systemCollector(),
    httpCollector({ maxRecords: 10_000 }),
    dbPoolCollector({ connectionName: 'postgres' }),
    redisCollector(),
    queueCollector({
      queueName: 'default',
      connection: {
        host: env.get('QUEUE_REDIS_HOST'),
        port: env.get('QUEUE_REDIS_PORT'),
        password: env.get('QUEUE_REDIS_PASSWORD'),
      },
    }),
    logCollector(),
    appCollector(),
  ],
})That's it for setup -- all API routes are auto-registered by the package. No controllers or route definitions needed. On startup you'll see:
[server-stats] auto-registered routes: /admin/api/server-stats, /admin/api/debug/*, /__stats/*
All routes are gated by the authorize callback if configured (see Visibility Control).
Edge (add before </body>):
@serverStats()All fields are optional. defineConfig({}) works with zero configuration.
| Option | Type | Default | Description |
|---|---|---|---|
pollInterval |
number |
3000 |
Collection + broadcast interval (ms) |
collectors |
'auto' | MetricCollector[] |
'auto' |
'auto' probes installed packages; or pass an explicit array |
realtime |
boolean |
true |
true = SSE via Transmit, false = poll-only |
statsEndpoint |
string | false |
'/admin/api/server-stats' |
HTTP endpoint. false to disable. |
authorize |
(ctx) => boolean |
-- | Per-request visibility guard |
unsafeAllowNoAuth |
boolean |
false |
Register the dashboard/debug/stats routes even with no authorize guard. Off by default (routes fail closed). Local dev only — exposes secrets, email bodies, and SQL. |
domain |
string |
-- | Restrict every route to one host, e.g. 'admin.example.com'. See Custom domain |
production |
ProductionConfig |
-- | Opt in to running in production. Off by default -- see Production |
onStats |
(stats) => void |
-- | Callback after each collection tick |
toolbar |
boolean | ToolbarConfig |
-- | true to enable with defaults, or pass a ToolbarConfig object |
dashboard |
boolean | DashboardConfig |
-- | true to enable at /__stats, or pass a DashboardConfig |
verbose |
boolean |
false |
Log initialization details (collectors, routes, etc) to console |
advanced |
AdvancedConfig |
-- | Rarely-needed options (channel name, db path, buffer sizes, etc) |
| Option | Type | Default | Description |
|---|---|---|---|
slowQueryThreshold |
number |
100 |
Slow query threshold (ms) |
tracing |
boolean |
true |
Enable per-request tracing with timeline |
persist |
boolean |
false |
Persist debug data to disk across restarts |
panes |
DebugPane[] |
-- | Custom debug panel tabs |
excludeFromTracing |
string[] |
['/admin/api/debug', '/admin/api/server-stats'] |
URL prefixes to exclude from tracing/persistence |
| Option | Type | Default | Description |
|---|---|---|---|
path |
string |
'/__stats' |
URL path for the dashboard page |
retentionDays |
number |
7 |
Days to keep historical data in SQLite |
maxDbSizeMb |
number |
500 |
Size cap for the SQLite database -- oldest rows are pruned when exceeded; 0 disables |
| Option | Type | Default | Description |
|---|---|---|---|
enabled |
boolean |
false |
Register routes and build the dashboard when NODE_ENV=production |
capture |
CaptureConfig |
all off | Which capture subsystems to switch on -- opt in one at a time |
retentionDays |
number |
3 |
SQLite history to keep in production (the usual default is 7) |
maxDbSizeMb |
number |
500 |
Size cap for the SQLite database in production; 0 disables |
CaptureConfig fields, each boolean and each defaulting to false in production: queries, events, emails, traces, logs.
| Option | Type | Default | Description |
|---|---|---|---|
skipInTest |
boolean |
true |
Skip collection during tests |
channelName |
string |
'admin/server-stats' |
Transmit channel name |
debugEndpoint |
string |
'/admin/api/debug' |
Base path for debug toolbar API endpoints |
renderer |
'preact' | 'vue' |
'preact' |
Client-side rendering library for Edge |
dbPath |
string |
'.adonisjs/server-stats/dashboard.sqlite3' |
Path to the SQLite database file |
persistPath |
string |
'.adonisjs/server-stats/debug-data.json' |
Path for persisted debug data |
maxQueries |
number |
500 |
Max SQL queries to buffer |
maxEvents |
number |
200 |
Max events to buffer |
maxEmails |
number |
100 |
Max emails to buffer |
maxTraces |
number |
200 |
Max request traces to buffer |
The following field names still work but will show deprecation warnings at boot. They will be removed in the next major version.
| Legacy Name | Replacement | Notes |
|---|---|---|
intervalMs |
pollInterval |
Same type and default |
transport |
realtime |
'transmit' = true, 'none' = false |
channelName |
advanced.channelName |
Same type and default |
endpoint |
statsEndpoint |
Same type and default |
shouldShow |
authorize |
Same type and default |
skipInTest |
advanced.skipInTest |
Same type and default |
devToolbar |
toolbar + dashboard + advanced |
Split into focused config objects |
Note: This is the internal, fully-expanded format. Most users should prefer the new
toolbar,dashboard, andadvancedoptions above -- they map to these fields automatically.
| Option | Type | Default | Description |
|---|---|---|---|
enabled |
boolean |
false |
Enable the dev toolbar |
maxQueries |
number |
500 |
Max SQL queries to buffer |
maxEvents |
number |
200 |
Max events to buffer |
maxEmails |
number |
100 |
Max emails to buffer |
slowQueryThresholdMs |
number |
100 |
Slow query threshold (ms) |
persistDebugData |
boolean | string |
false |
Persist debug data to disk across restarts. true writes to .adonisjs/server-stats/debug-data.json, or pass a custom path. |
tracing |
boolean |
true |
Enable per-request tracing with timeline visualization |
maxTraces |
number |
200 |
Max request traces to buffer |
dashboard |
boolean |
false |
Enable the full-page dashboard (requires better-sqlite3) |
dashboardPath |
string |
'/__stats' |
URL path for the dashboard page |
retentionDays |
number |
7 |
Days to keep historical data in SQLite |
maxDbSizeMb |
number |
500 |
Size cap for the SQLite database's live data. When exceeded, the cleanup deletes the oldest records regardless of age. 0 disables the cap. |
dbPath |
string |
'.adonisjs/server-stats/dashboard.sqlite3' |
Path to the SQLite database file (relative to app root) |
debugEndpoint |
string |
'/admin/api/debug' |
Base path for the debug toolbar API endpoints |
excludeFromTracing |
string[] |
['/admin/api/debug', '/admin/api/server-stats'] |
URL prefixes to exclude from tracing and dashboard persistence. Requests still count toward HTTP metrics but won't appear in the timeline or be stored. The stats endpoint is always excluded automatically. |
cacheKeyPrefix |
string |
-- | Allow-list prefix for the Cache tab (e.g. 'myapp:cache:'). Scopes which Redis keys can be listed, read, and deleted. Unset: unrestricted in dev, single-key access refused in production. Env var SERVER_STATS_CACHE_KEY_PREFIX works as a fallback. |
emailBridgeChannel |
string |
'adonisjs-server-stats:emails' |
Redis pub/sub channel for the cross-process email bridge. Namespace it on a shared Redis so other subscribers cannot read your outbound mail. |
panes |
DebugPane[] |
-- | Custom debug panel tabs |
When
collectorsis'auto'(the default), the package probes installed packages at boot and enables matching collectors automatically. On startup you'll see a log showing all 8 collectors with a checkmark or cross and which packages were found or missing. You only need to specify collectors explicitly if you want to customize their options.
Each collector is a factory function that returns a MetricCollector. All collectors run in parallel each tick; missing peer dependencies are handled gracefully (the collector returns defaults instead of crashing).
| Collector | Metrics | Options | Peer Deps |
|---|---|---|---|
processCollector() |
CPU %, event loop lag, heap/RSS memory, uptime, Node version | none | -- |
systemCollector() |
OS load averages, system memory, system uptime | none | -- |
httpCollector(opts?) |
Requests/sec, avg response time, error rate, active connections | optional | -- |
dbPoolCollector(opts?) |
Pool used/free/pending/max connections | optional | @adonisjs/lucid |
redisCollector() |
Status, memory, clients, keys, hit rate | none | @adonisjs/redis |
queueCollector(opts) |
Active/waiting/delayed/failed jobs, worker count | required | bullmq or @adonisjs/queue/@boringnode/queue (auto-detected) |
logCollector(opts?) |
Errors/warnings/entries (5m window), entries/minute | optional | -- |
appCollector() |
Online users, pending webhooks, pending emails | none | @adonisjs/lucid |
Warning
appCollector() polls your primary database -- three COUNT(*) queries every collection interval (3s by default), forever. Index the columns it filters on or every tick is a full table scan:
CREATE INDEX webhook_events_status_index ON webhook_events (status);
CREATE INDEX scheduled_emails_status_index ON scheduled_emails (status);httpCollector({
maxRecords: 10_000, // Circular buffer size (default: 10,000)
windowMs: 60_000, // Rolling window for rate calc (default: 60s)
})
dbPoolCollector({
connectionName: 'postgres', // Lucid connection name (default: 'postgres')
})
queueCollector({
queueName: 'default',
connection: {
host: 'localhost',
port: 6379,
password: 'secret',
},
})
// Zero-config: hooks into AdonisJS Pino logger automatically
logCollector()
// Or file-based fallback:
logCollector({ logPath: 'logs/adonisjs.log' })Implement the MetricCollector interface to create your own:
import type { MetricCollector } from 'adonisjs-server-stats'

function diskCollector(): MetricCollector {
  return {
    name: 'disk',
    async collect() {
      const { availableSpace, totalSpace } = await getDiskInfo()
      return {
        diskAvailableGb: availableSpace / 1e9,
        diskTotalGb: totalSpace / 1e9,
        diskUsagePercent: ((totalSpace - availableSpace) / totalSpace) * 100,
      }
    },
  }
}

// config/server_stats.ts
export default defineConfig({
  collectors: [
    processCollector(),
    diskCollector(), // mix with built-in collectors
  ],
})
The MetricCollector interface:
interface MetricCollector {
  name: string
  start?(): void | Promise<void>
  stop?(): void | Promise<void>
  collect(): Record<string, MetricValue> | Promise<Record<string, MetricValue>>
}Use authorize to control who can see the stats bar and access all auto-registered API routes (stats, debug, dashboard). The callback receives the AdonisJS HttpContext and should return true to allow access, false to deny (403).
Because authorize runs after middleware (including auth), you have full access to ctx.auth.
export default defineConfig({
  // Only show in development
  authorize: () => env.get('NODE_ENV'),
})
export default defineConfig({
// Only show for logged-in admin users
authorize: (ctx) => ctx.auth?.user?.isAdmin === true,
})export default defineConfig({
// Only show for specific roles
authorize: (ctx) => {
const role = ctx.auth?.user?.role
return role === 'admin' || role === 'superadmin'
},
})Fail closed: When neither
authorizenorshouldShowis set, the dashboard, debug API, and stats routes are not registered at all and a warning is logged. To run without a guard during local development, setunsafeAllowNoAuth: true— this exposes secrets, email bodies, and SQL to anyone who can reach the routes, so never use it outside strictly local dev.Migration note:
shouldShowstill works as a deprecated alias forauthorize— same signature, same behavior, and it fully satisfies the guard requirement above. If you already setshouldShow(orauthorize), this change does not affect you; you'll only see a one-time rename hint at boot.
By default this package does nothing when NODE_ENV=production -- no routes are registered and neither the debug nor the dashboard store is built. The metrics engine still runs, so onStats, Prometheus, and Transmit broadcasting keep working; there is simply no HTTP surface. The @serverStats() Edge tag stays registered and renders nothing, so it can live in your layout unconditionally.
Set production.enabled to lift that:
export default defineConfig({
  authorize: async (ctx) => (await ctx.auth.check()) && ctx.auth.user?.isAdmin === true,
  dashboard: true,

  production: {
    enabled: true,
    capture: { queries: true }, // everything else stays off
    retentionDays: 3,
  },
})unsafeAllowNoAuth is ignored in production. Without a guard the routes are not registered and a warning explains why -- an unauthenticated dashboard on a production host is never correct.
When production mode is active you get an unmissable startup banner, so nobody enables this and forgets:
[ server-stats ] DASHBOARD IS LIVE IN PRODUCTION
  reachable at:  /admin/api/server-stats, /admin/api/debug/*, /__stats/*
  guard:         authorize() configured
  capturing:     queries
  data at:       .adonisjs/server-stats/dashboard.sqlite3 (retention: 3 days)
Each capture subsystem hooks something global and stores something sensitive, so in production every one starts off and is enabled by name:
capture flag |
What it records | Why it's off by default |
|---|---|---|
queries |
SQL text, bindings, timings | Bindings can hold values you would not log |
events |
Application events (memory only) | Patches the emitter's emit() process-wide |
emails |
Sent mail incl. subject and body | Highest-sensitivity payload in the package |
traces |
Per-request spans | Wraps every request in AsyncLocalStorage |
logs |
Log lines into SQLite | Highest write volume, and logs quote payloads |
With no capture flags at all you still get the useful core: the request list, the overview, and the charts. Those come from request rows and 1-minute metric buckets, at a small fraction of full dev-mode write volume. Turn capture on when you are actually debugging something.
A disabled subsystem is never subscribed, so it costs nothing -- its dashboard pane simply stays empty.
Note
toolbar: { tracing: false } still overrides capture.traces. It is the older kill switch and keeps winning.
Retention prunes rows older than retentionDays on boot and hourly, and returns freed pages to the OS incrementally, so the .sqlite3 file genuinely shrinks after cleanup. Watch real numbers in the dashboard's storage panel (GET {dashboardPath}/api/storage), which reports file size, WAL size, and per-table row counts.
maxDbSizeMb (default 500) additionally caps the database's live data size. When write volume outruns what retentionDays alone would keep small -- tracing plus persistence on a busy app can write hundreds of MB per day -- the cleanup deletes the globally oldest records, regardless of age, until usage drops below the cap. In other words, the retention window shortens dynamically instead of the file growing without bound. Set maxDbSizeMb: 0 to disable the cap.
There is no sampling. On a high-traffic app, enable capture deliberately and keep retentionDays short.
An authorize callback may be sync or async -- the route guard awaits it, so async (ctx) => { await ctx.auth.authenticate(); ... } is safe.
Warning
The @serverStats() Edge toolbar evaluates the guard synchronously while rendering, so it cannot await. With an async guard the stats bar hides itself rather than risk showing when it shouldn't, and logs a warning once. The HTTP routes are guarded correctly either way -- only the cosmetic bar is affected. Use a synchronous guard if you want the bar in production.
Worth knowing before you expose it, even behind an admin guard:
- One guard, no tiers. Anyone who passes
authorizecan alsoDELETE /api/cache/:keyandPOST /api/jobs/:id/retry. Scope cache access withadvanced.cacheKeyPrefix(or theSERVER_STATS_CACHE_KEY_PREFIXenv var) -- unset means unrestricted in dev, and in production single-key cache reads/deletes are refused until a prefix is configured. - No audit log and no rate limiting on those mutating endpoints.
- Redaction is pattern-based, not exhaustive. SQL bindings, config/env values, stored URLs, and persisted log records are all redacted against a shared rule set (credential-shaped names incl. camelCase, hashes, JWTs, provider key prefixes, long hex/base64 blobs), and anything that survives is truncated at 256 chars. A secret under a name the patterns don't recognise, with an ordinary-looking value, still gets stored.
All API routes are registered automatically by the package during boot() -- no manual controllers or route definitions needed. Each route group is gated by the authorize callback if configured.
Registered when statsEndpoint is a string (default: /admin/api/server-stats). Returns the latest stats snapshot as JSON.
Registered when toolbar is enabled. Base path configurable via advanced.debugEndpoint (default: /admin/api/debug).
| Method | Path | Description |
|---|---|---|
| GET | /queries |
SQL queries with summary stats |
| GET | /events |
Application events |
| GET | /routes |
Registered route table |
| GET | /logs |
Paginated log entries (up to 200) |
| GET | /emails |
Captured emails (stripped HTML) |
| GET | /emails/:id/preview |
Email HTML preview |
| GET | /traces |
Request traces with log correlation |
| GET | /traces/:id |
Trace detail with spans and related logs |
| GET | /config |
Debug store configuration |
| GET | /diagnostics |
Provider diagnostics and status |
Registered when dashboard is enabled. Base path configurable via dashboard.path (default: /__stats).
| Method | Path | Description |
|---|---|---|
| GET | / |
Dashboard page (HTML) |
| GET | /api/overview |
Overview metrics |
| GET | /api/overview/chart |
Time-series chart data |
| GET | /api/requests |
Paginated request history |
| GET | /api/requests/:id |
Request detail with queries/trace |
| GET | /api/queries |
Paginated query list |
| GET | /api/queries/grouped |
Queries grouped by normalized SQL |
| GET | /api/queries/:id/explain |
EXPLAIN plan for a query |
| GET | /api/events |
Paginated event list |
| GET | /api/routes |
Route table |
| GET | /api/logs |
Paginated log entries |
| GET | /api/emails |
Paginated email list |
| GET | /api/emails/:id/preview |
Email HTML preview |
| GET | /api/traces |
Paginated trace list |
| GET | /api/traces/:id |
Trace detail with spans |
| GET | /api/cache |
Cache stats and key listing |
| GET | /api/cache/:key |
Cache key detail |
| DELETE | /api/cache/:key |
Delete a cache key |
| GET | /api/jobs |
Job queue overview |
| GET | /api/jobs/:id |
Job detail |
| POST | /api/jobs/:id/retry |
Retry a failed job |
| GET | /api/config |
App config (secrets redacted) |
| GET | /api/filters |
Saved filters |
| POST | /api/filters |
Create saved filter |
| DELETE | /api/filters/:id |
Delete saved filter |
By default every route is registered on whatever host your app serves. Set domain to bind them to one host instead -- useful when your admin surface already lives on its own subdomain:
export default defineConfig({
  domain: 'admin.example.com',
  authorize: (ctx) => ctx.auth?.user?.role === 'admin',
  toolbar: true,
  dashboard: true,
})
The dashboard is then reachable at admin.example.com/__stats and nowhere else -- a request to example.com/__stats no longer matches any route. Dynamic subdomains use AdonisJS's :param syntax:
export default defineConfig({
  domain: ':tenant.example.com', // matches acme.example.com, globex.example.com, ...
})
Pass a bare host. A protocol, path, or port (https://admin.example.com, admin.example.com:3333) produces routes that match nothing; defineConfig warns when it spots one.
The toolbar follows the domain. The
@serverStats()Edge tag and the React/Vue components request relative URLs, so they only work on pages served from the configured domain. Render the toolbar onexample.comwhiledomainpoints atadmin.example.comand the bar will sit empty -- its polls 404 against the wrong host. Either serve the toolbar from the same domain, or leavedomainunset and rely onauthorizealone.
Reminder: routes are not registered in production unless you opt in via
production.enabled. Without that,domainapplies to your dev and staging environments only.
Auto-registered routes bypass route-level middleware but are still subject to global/server middleware.
Session middleware: If you have session middleware registered globally in router.use(), every polling request (every ~3 seconds) will trigger a Set-Cookie response. The package automatically strips Set-Cookie headers from its own routes to prevent cookie accumulation, but for cleanest results we recommend moving session middleware to a named route group:
// start/kernel.ts — remove session from router.use()
router.use([
  () => import('@adonisjs/core/bodyparser_middleware'),
  // () => import('@adonisjs/session/session_middleware'),  ← remove
  () => import('@adonisjs/shield/shield_middleware'),
])

// start/routes.ts — add to your route groups instead
router.group(() => {
  // your app routes here
}).use(middleware.session())
Auth middleware: If you have auth middleware (like silentAuth) registered globally, each polling request will trigger a DB query every few seconds.
To avoid this, either:
- Move auth middleware to a named route group instead of global middleware
- Use the
authorizecallback for access control (recommended)
The @serverStats() Edge tag renders a self-contained stats bar with inline HTML, CSS, and JS -- no external assets, no build step.
<body>
  @inertia()
  @serverStats()
</body>
Features:
- Polls the stats API at the configured interval
- Color-coded thresholds (green/amber/red)
- SVG sparkline charts with gradient fills
- Hover tooltips with min/max/avg stats
- Show/hide toggle (persisted via localStorage)
- Auto-hides for non-admin users (403 detection)
- Scoped CSS (
.ss-prefix) - Stale connection indicator (amber dot after 10s)
Alpha feature. The React and Vue integrations are new and may have rough edges. Bug reports and feedback are very welcome — please open an issue.
If you're using Inertia.js with React or Vue instead of Edge templates, you can drop in the same stats bar, debug panel, and dashboard as fully native components. Same data, same styling, same features — just framework-native.
No extra packages needed. The components ship inside the main package:
npm install adonisjs-server-statsPeer dependencies (all optional — install what you use):
# React
npm install react react-dom

# Vue
npm install vue

# Real-time updates (optional — falls back to polling)
npm install @adonisjs/transmit-clientimport { ServerStatsBar, DebugPanel, DashboardPage } from 'adonisjs-server-stats/react'
import 'adonisjs-server-stats/react/css'
// Stats bar — drop into your layout
<ServerStatsBar endpoint="/admin/api/server-stats" pollInterval={3000} />
// Debug panel — same layout, add below the stats bar
<DebugPanel debugEndpoint="/admin/api/debug" />
// Dashboard — use as a full Inertia page
<DashboardPage dashboardEndpoint="/__stats/api" />Available hooks:
import {
  useServerStats,
  useDebugData,
  useDashboardData,
  useTheme,
  useFeatures,
} from 'adonisjs-server-stats/react'<script setup>
import { ServerStatsBar, DebugPanel, DashboardPage } from 'adonisjs-server-stats/vue'
import 'adonisjs-server-stats/vue/css'
</script>
<template>
<!-- Stats bar — drop into your layout -->
<ServerStatsBar endpoint="/admin/api/server-stats" :poll-interval="3000" />
<!-- Debug panel -->
<DebugPanel debug-endpoint="/admin/api/debug" />
<!-- Dashboard — use as a full Inertia page -->
<DashboardPage dashboard-endpoint="/__stats/api" />
</template>Available composables:
import {
  useServerStats,
  useDebugData,
  useDashboardData,
  useTheme,
  useFeatures,
} from 'adonisjs-server-stats/vue'For advanced composition, React also exports lower-level UI primitives:
import {
  ThemeToggle,
  Badge,
  MethodBadge,
  StatusBadge,
  JsonViewer,
  Tooltip,
} from 'adonisjs-server-stats/react'The components auto-detect your auth setup:
- Cookie auth (default Inertia setup) — requests use
credentials: 'include'automatically - Bearer token — pass
authTokenas a prop to any component
The same authorize callback you configure on the server gates all API routes. If a user isn't authorized, the components detect the 403 and hide themselves.
If @adonisjs/transmit-client is installed, the stats bar subscribes to SSE for instant updates. Otherwise it falls back to polling at the configured interval. No configuration needed — it just works.
The React and Vue components share the same theme system as Edge. Dark/light preference syncs across all three UIs via localStorage, including cross-tab sync.
- The dashboard page is large — lazy-loading helps but initial bundle may be significant
- Some edge cases in custom pane rendering may not be fully covered yet
- Error boundaries are minimal — a bad API response may cause a blank panel
- Only tested with React 18/19 and Vue 3.3+
Found a bug? Have feedback? Open an issue — it helps a lot.
Adds a debug panel with SQL query inspection, event tracking, email capture with HTML preview, route table, live logs, and per-request tracing. Active in non-production environments by default; see Production to opt in there.
export default defineConfig({
  toolbar: {
    slowQueryThreshold: 100,
    tracing: true,
    persist: true,
  },
})
Debug routes are auto-registered by the package at /admin/api/debug/* (configurable via advanced.debugEndpoint).
Legacy format (deprecated)
export default defineConfig({
  devToolbar: {
    enabled: true,
    maxQueries: 500,
    maxEvents: 200,
    maxEmails: 100,
    slowQueryThresholdMs: 100,
    persistDebugData: true,
    tracing: true,
  },
})The debug toolbar captures all emails sent via AdonisJS mail (mail:sending, mail:sent, mail:queued, queued:mail:error events). Click any email row to preview its HTML in an iframe.
Note: Email previews are rendered in an iframe. If your app uses
@adonisjs/shieldwith the defaultX-Frame-Options: DENYheader, the preview will be blocked. Change it toSAMEORIGINin your shield config:// config/shield.ts xFrame: { enabled: true, action: 'SAMEORIGIN', },
AdonisJS mail events (mail:sending, mail:sent, etc.) are process-local. If your app sends emails from queue workers (BullMQ via @rlanz/bull-queue, or @adonisjs/queue/@boringnode/queue) or other separate processes, the web server's email collector never sees them.
The provider handles this automatically via a Redis pub/sub bridge:
- In queue workers (
consoleenvironment), the provider only starts a lightweight email bridge publisher — no debug store, routes, or dashboard overhead - When an email is sent, the event is published to a Redis pub/sub channel
- In the web server (
webenvironment), the provider subscribes to the same channel and ingests the email into both the debug panel and the dashboard
Worker-sent emails appear in the dashboard with HTML preview alongside emails sent from web requests — no additional configuration needed.
Requirements:
@adonisjs/redismust be installed and configured (used for pub/sub between processes)- The provider must be registered without an
environmentrestriction so it loads in all environments:
// adonisrc.ts
providers: [
  () => import('adonisjs-server-stats/provider'), // runs in web + console
]
Note: If you previously used separate
adonisjs-server-stats/email-bridge/providerandadonisjs-server-stats/log-stream/providerregistrations, you can replace all three with the single provider above. The email bridge and log stream functionality are now built into the main provider.
Enable toolbar.persist: true (or the legacy devToolbar.persistDebugData: true) to save queries, events, and emails to .adonisjs/server-stats/debug-data.json. You can customize the path via advanced.persistPath. Data is:
- Loaded on server startup (before collectors start)
- Flushed every 30 seconds (handles crashes)
- Saved on graceful shutdown
When tracing: true is set, the debug panel gains a Timeline tab that shows a waterfall view of every HTTP request -- which DB queries ran, in what order, and how long each took.
Tracing uses AsyncLocalStorage to automatically correlate operations to the request that triggered them. DB queries captured via db:query events and console.warn calls are automatically attached to the active request trace.
GET /organizations/create    286ms
├─ SELECT * FROM users          2ms  █
├─ SELECT * FROM orgs           4ms    █
├─ fetchMembers (custom)      180ms    ██████████████████
└─ response sent                5ms                      ██
- The Timeline tab shows a list of recent requests with method, URL, status code, duration, span count, and any warnings
- Click a request to see the waterfall chart -- each span is a horizontal bar positioned by time offset, color-coded by category
- Spans can be nested (a custom span wrapping DB queries will show them indented)
| Category | Color | Auto-captured |
|---|---|---|
| DB | Purple | db:query events |
| Request | Blue | Full request lifecycle |
| Green | -- | |
| Event | Amber | -- |
| View | Cyan | -- |
| Custom | Gray | Via trace() helper |
Use the trace() helper to wrap any async code in a named span:
import { trace } from 'adonisjs-server-stats'

// In a controller or service:
const result = await trace('organization.fetchMembers', async () => {
  return OrganizationService.getMembers(orgId)
})
If tracing is disabled or no request is active, trace() executes the function directly with no overhead.
When viewing a trace detail (either in the debug panel Timeline tab or the dashboard), related log entries are automatically correlated using the HTTP request ID (ctx.request.id()). Any logs emitted during the request appear in a "Related Logs" section below the waterfall chart.
This works with both SQLite persistence (joins on http_request_id) and in-memory mode (scans the log file for matching request_id entries). No configuration needed — if your app uses AdonisJS request IDs, correlation happens automatically.
The dashboard is a dedicated page that provides historical data, charts, query analysis, and integration inspectors -- all persisted to a local SQLite database. It's like having Laravel Telescope built into your dev toolbar.
The dashboard requires better-sqlite3 for local data storage:
npm install better-sqlite3If better-sqlite3 is not installed, the dashboard will log a helpful message and disable itself gracefully -- the rest of the stats bar and debug toolbar continues to work.
// config/server_stats.ts
export default defineConfig({
  dashboard: true,
})
Restart your dev server and visit /__stats (or your configured dashboard.path).
export default defineConfig({
  dashboard: {
    path: '/__stats',
    retentionDays: 7,
  },
  toolbar: {
    tracing: true,
    excludeFromTracing: ['/admin/api/debug'],
  },
  advanced: {
    dbPath: '.adonisjs/server-stats/dashboard.sqlite3',
  },
})| Section | Description |
|---|---|
| Overview | Performance cards (avg/p95 response time, req/min, error rate) with sparkline charts and configurable time ranges (1h/6h/24h/7d) |
| Requests | Paginated request history with method, URL, status, duration. Click for detail view with associated queries and trace |
| Queries | All captured SQL queries with duration, model, connection. Grouped view shows query patterns by normalized SQL. EXPLAIN plan support for SELECT queries |
| Events | Application events captured from the AdonisJS emitter |
| Routes | Full route table with methods, patterns, handlers, and middleware stacks |
| Logs | Log history with level filtering, text search, and structured JSON field search (e.g. filter by userId = 5) |
| Emails | Email history with sender, recipient, subject, status. Click for HTML preview in iframe |
| Timeline | Per-request waterfall timeline (requires tracing: true) |
| Cache | Redis key browser with SCAN-based listing, type-aware detail view, and server stats (requires @adonisjs/redis) |
| Jobs | Queue overview with job listing, detail, and retry for failed jobs (requires bullmq or @adonisjs/queue/@boringnode/queue — auto-detected) |
| Config | Sanitized view of app configuration and environment variables. Secrets are auto-redacted |
The dashboard reuses the authorize callback from the main config. If set, all dashboard routes are gated by it -- unauthorized requests receive a 403.
export default defineConfig({
  authorize: (ctx) => ctx.auth?.user?.role === 'admin',
  dashboard: true,
})When the dashboard is enabled, the debug panel gains link icons on query, event, email, and trace rows. Clicking them opens the dashboard in a new tab, navigating directly to the relevant section and item.
The dashboard supports real-time updates via two mechanisms:
- Transmit (SSE): If
@adonisjs/transmitis installed, the dashboard subscribes toserver-stats/dashboardfor live overview updates - Polling fallback: If Transmit is not available, the dashboard polls the API at a configurable interval
The dashboard uses a dedicated SQLite database (separate from your app's database) with 8 tables prefixed with server_stats_. The database is:
- Auto-migrated on startup (no manual migration step)
- Self-contained -- uses its own Knex connection, never touches your app's migration history
- Self-cleaning -- old data is automatically purged based on
retentionDays - WAL mode -- concurrent reads don't block writes
The SQLite file is created at the configured advanced.dbPath (default: .adonisjs/server-stats/dashboard.sqlite3). Add it to your .gitignore:
.adonisjs/server-stats/
All three UIs (dashboard, debug panel, and stats bar) support dark and light themes:
- System preference -- automatically follows
prefers-color-scheme(dark is default) - Manual toggle -- sun/moon button in the dashboard sidebar and debug panel tab bar
- Synced -- theme choice is shared via
localStorageacross all three UIs, including cross-tab sync - Scoped -- CSS variables are scoped to their containers, so they won't leak into your app's styles
Add custom tabs to the debug panel:
import { defineConfig } from 'adonisjs-server-stats'
import type { DebugPane } from 'adonisjs-server-stats'

const webhooksPane: DebugPane = {
  id: 'webhooks',
  label: 'Webhooks',
  endpoint: '/admin/api/debug/webhooks',
  columns: [
    { key: 'id', label: '#', width: '40px' },
    { key: 'event', label: 'Event', searchable: true },
    { key: 'url', label: 'URL', searchable: true },
    {
      key: 'status',
      label: 'Status',
      width: '80px',
      format: 'badge',
      badgeColorMap: { delivered: 'green', pending: 'amber', failed: 'red' },
    },
    { key: 'duration', label: 'Duration', width: '70px', format: 'duration' },
    { key: 'timestamp', label: 'Time', width: '80px', format: 'timeAgo' },
  ],
  search: { placeholder: 'Filter webhooks by event or URL...' },
  clearable: true,
}

export default defineConfig({
  toolbar: {
    panes: [webhooksPane],
  },
})
The endpoint must return JSON with the data array under a key matching the pane id (or dataKey):
// Controller
async webhooks({ response }: HttpContext) {
  const events = await WebhookEvent.query().orderBy('created_at', 'desc').limit(200)
  return response.json({ webhooks: events })
}| Option | Type | Default | Description |
|---|---|---|---|
id |
string |
-- | Unique identifier (also default data key) |
label |
string |
-- | Tab display name |
endpoint |
string |
-- | API endpoint URL |
columns |
DebugPaneColumn[] |
-- | Column definitions |
search |
{ placeholder } |
-- | Enable search bar |
dataKey |
string |
id |
JSON key for data array (dot notation OK) |
fetchOnce |
boolean |
false |
Cache after first fetch |
clearable |
boolean |
false |
Show Clear button |
| Option | Type | Default | Description |
|---|---|---|---|
key |
string |
-- | JSON field name |
label |
string |
-- | Column header text |
width |
string |
auto | CSS width (e.g. '60px') |
format |
DebugPaneFormatType |
'text' |
Cell format (see table below) |
searchable |
boolean |
false |
Include in search filtering |
filterable |
boolean |
false |
Click to set as search filter |
badgeColorMap |
Record<string, string> |
-- | Value-to-color map for badge format |
| Format | Renders As | Expected Input |
|---|---|---|
text |
Escaped plain text | any |
time |
HH:MM:SS.mmm |
Unix timestamp (ms) |
timeAgo |
3s ago, 2m ago |
Unix timestamp (ms) |
duration |
X.XXms with color coding |
number (ms) |
method |
HTTP method pill badge | 'GET', 'POST', etc. |
json |
Compact preview, click to expand | object or array |
badge |
Colored pill via badgeColorMap |
string |
Badge colors: green, amber, red, blue, purple, muted
Export all metrics as Prometheus gauges. Requires @julr/adonisjs-prometheus.
// config/prometheus.ts
import { defineConfig } from '@julr/adonisjs-prometheus'
import { httpCollector } from '@julr/adonisjs-prometheus/collectors/http_collector'
import { serverStatsCollector } from 'adonisjs-server-stats/prometheus'

export default defineConfig({
  endpoint: '/metrics',
  collectors: [httpCollector(), serverStatsCollector()],
})
Gauges are updated automatically on each collection tick.
The log stream module watches a JSON log file and broadcasts new entries via Transmit (SSE).
Two purposes:
- Provides error/warning counts to the stats bar via
logCollector() - Broadcasts individual log entries to a Transmit channel via
LogStreamProvider
Standalone usage:
import { LogStreamService } from 'adonisjs-server-stats/log-stream'

const service = new LogStreamService('logs/app.log', (entry) => {
  console.log('New log entry:', entry)
})

await service.start()
// later...
service.stop()All types are exported for consumer use:
// Core types
import type {
  ServerStats,
  ServerStatsConfig,
  ResolvedServerStatsConfig,
  MetricCollector,
  MetricValue,
  LogStats,
  DevToolbarOptions,
  ToolbarConfig,
  DashboardConfig,
  AdvancedConfig,
} from 'adonisjs-server-stats'

// Debug types
import type {
  DebugPane,
  DebugPaneColumn,
  DebugPaneFormatType,
  DebugPaneSearch,
  BadgeColor,
  QueryRecord,
  EventRecord,
  EmailRecord,
  RouteRecord,
  TraceSpan,
  TraceRecord,
} from 'adonisjs-server-stats'

// Dashboard types
import type {
  RequestFilters,
  QueryFilters,
  EventFilters,
  EmailFilters,
  LogFilters,
  TraceFilters,
  PaginatedResult,
} from 'adonisjs-server-stats'

// Dashboard store (for advanced use)
import { DashboardStore } from 'adonisjs-server-stats'

// Trace helper
import { trace } from 'adonisjs-server-stats'

// Collector option types
import type {
  HttpCollectorOptions,
  DbPoolCollectorOptions,
  QueueCollectorOptions,
  QueueRedisConnection,
  LogCollectorOptions,
} from 'adonisjs-server-stats/collectors'All integrations use lazy import() -- missing peer deps won't crash the app. The corresponding collector simply returns defaults.
| Dependency | Required By |
|---|---|
@adonisjs/core |
Everything (required) |
@adonisjs/lucid |
dbPoolCollector, appCollector, dashboard |
@adonisjs/redis |
redisCollector, dashboard cache inspector |
@adonisjs/transmit |
Provider (SSE broadcast), dashboard real-time |
@adonisjs/transmit-client |
React/Vue real-time updates (falls back to polling) |
@julr/adonisjs-prometheus |
serverStatsCollector |
bullmq |
queueCollector (BullMQ backend) |
@adonisjs/queue |
queueCollector (AdonisJS queue backend, auto-detected) |
@boringnode/queue |
queueCollector (AdonisJS queue backend, auto-detected) |
better-sqlite3 |
Dashboard (dashboard: true) |
edge.js |
Edge tag |
react, react-dom |
React components (alpha) |
vue |
Vue components (alpha) |
MIT