
On-prem AI agents have no invoice. costbench gives them one — priced in joules measured on the card that ran the work.
A private AI agent, a cost-governance gateway, and the benchmark that makes the gateway's numbers real. All local, all on AMD Radeon, zero egress.
AMD AI DevMaster · Track 2: Agentic AI · AMD Radeon PRO W7900 (gfx1100) ·
ROCm 7.2.1 · llama.cpp HIP · egress: on-prem only
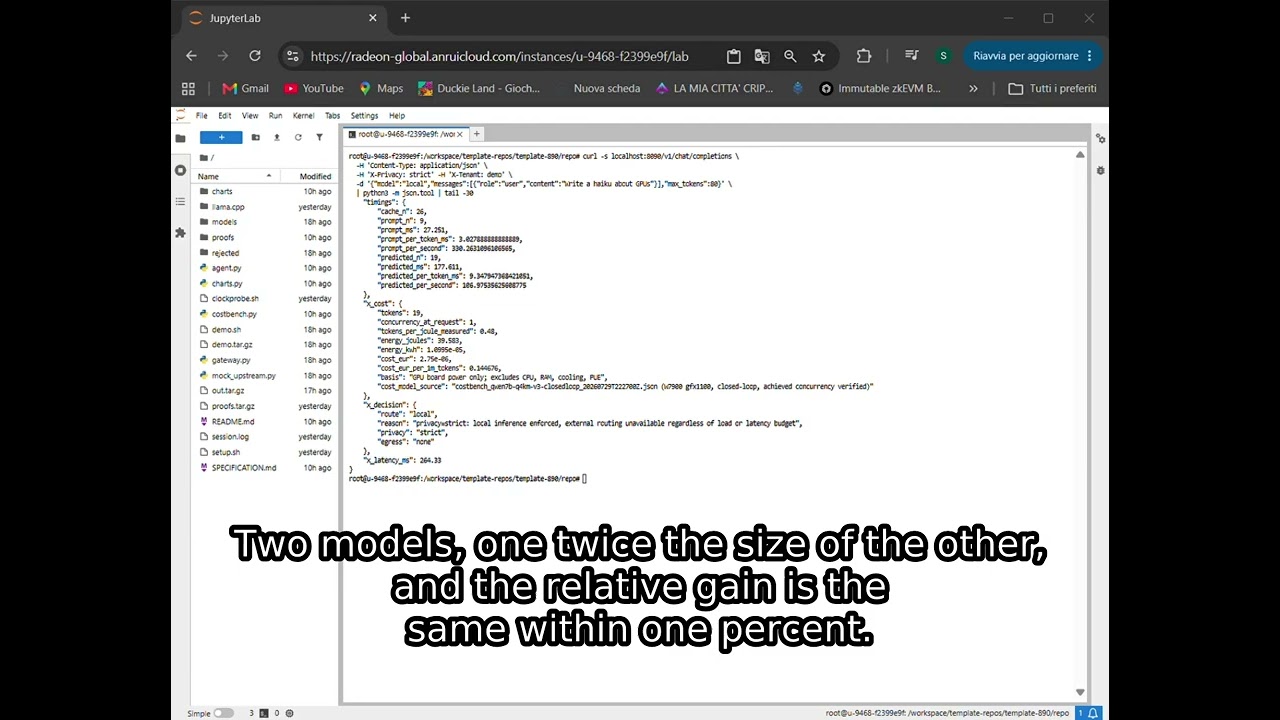
Four minutes: resolving the right power sensor on a shared 8-GPU host, the benchmark running live on the W7900, the cross-model result, and an agent task priced in measured joules with zero egress.
An agent reads files, plans across steps, answers — and then tells you exactly what that cost:
3 steps · 194 tokens · 404.2 J · EUR 0.000028 · 0 bytes left the network
Every one of those figures is derived from a measurement of this GPU, not a price list, and the zero is verified against an audit ledger rather than asserted in prose.
Three situations where that matters:
Regulated deployment. A legal or clinical team runs an assistant on
documents that must not leave the building. X-Privacy: strict routes
locally regardless of load, latency budget, or whether a cloud provider is
even configured — and every request, its route, its reason and its egress
land in a local SQLite ledger you can export and hand to an auditor.
Internal chargeback. One GPU, several departments, no invoice to split. costbench meters per-tenant tokens and converts them to joules and euros using a curve measured on that specific card, so the allocation is defensible instead of arbitrary.
Scheduling decisions. Serve now, or queue and batch? costbench measured the actual trade-off on this hardware: batching to 16 concurrent requests cuts energy per token by 88% and raises time-to-first-token 7.8×. That's a policy input, and it's a measurement.
Measured on a single Radeon PRO W7900, llama.cpp with the HIP backend, all layers offloaded, continuous batching enabled.
| Qwen2.5-Coder-7B Q4_K_M | Qwen2.5-Coder-14B Q4_K_M | |
|---|---|---|
| Peak sustained throughput | 696.3 tok/s | 411.6 tok/s |
| Single-stream throughput | 103.1 tok/s | 57.3 tok/s |
| Throughput gain from batching | 6.75× | 7.19× |
| Time to first token (single stream) | 25 ms | 56 ms |
| Peak power | 229 W | 237 W |
Both models run entirely locally in the W7900's 51.5 GB, with a 32k context across 4 agent slots. Sustained 90-second runs, closed-loop load, achieved concurrency verified per run.
The optimisation that dominates on this hardware is batch scheduling, and its magnitude was unknown until measured — which is what the rest of this repository is about.
Every number below is tagged measured and reproducible from
proofs/. One measurement was rejected as invalid and is kept,
with its post-mortem, in rejected/.
| Model | conc 1 → 16 | tokens/joule gain |
|---|---|---|
| Qwen2.5-Coder-7B Q4_K_M | 0.476 → 4.142 | 8.70× |
| Qwen2.5-Coder-14B Q4_K_M | 0.253 → 2.229 | 8.80× |
Two models, one twice the size of the other, produce the same relative gain to within 1%. Normalise each curve by its own concurrency-1 value and they lie on top of each other.

| concurrency | 7B tok/J | 14B tok/J | ratio |
|---|---|---|---|
| 1 | 0.476 | 0.253 | 0.53 |
| 4 | 0.946 | 0.492 | 0.52 |
| 16 | 4.142 | 2.229 | 0.54 |
Double the weights, roughly half the efficiency, at every concurrency level. The signature of a memory-bandwidth-bound decode: each token re-reads the full weight set from GDDR6, so doubling the weights halves the tokens you get per joule.
| concurrency | 7B power | 14B power |
|---|---|---|
| 1 | 216.5 W | 226.1 W |
| 4 | 229.0 W | 236.9 W |
| 16 | 168.1 W | 184.7 W |
Both models peak at concurrency 4, then draw less power at concurrency 16 while doing ~6.8× the work. Reproduced across models and four independent sessions.

Energy is not free money. It is bought with latency.
| 7B | 14B | |
|---|---|---|
| Energy cost per 1M tokens | €0.1458 → €0.0168 (−88.5%) | €0.2741 → €0.0312 (−88.6%) |
| Time to first token (p50) | 25 ms → 196 ms (7.8×) | 56 ms → 571 ms (10.2×) |

Arbitrating that trade-off is the gateway's job.
| Model | Conc | Achieved | Throughput (tok/s) | Power (W) | Tokens/J | TTFT p50 (ms) | EUR/1M tokens |
|---|---|---|---|---|---|---|---|
| Qwen2.5-Coder-14B Q4_K_M | 1 | 1 | 57.3 | 226.1 | 0.253 | 56 | 0.2741 |
| Qwen2.5-Coder-14B Q4_K_M | 4 | 4 | 116.6 | 236.9 | 0.492 | 170 | 0.1410 |
| Qwen2.5-Coder-14B Q4_K_M | 16 | 16 | 411.6 | 184.7 | 2.229 | 571 | 0.0312 |
| Qwen2.5-Coder-7B Q4_K_M | 1 | 1 | 103.1 | 216.5 | 0.476 | 25 | 0.1458 |
| Qwen2.5-Coder-7B Q4_K_M | 4 | 4 | 216.6 | 229.0 | 0.946 | 67 | 0.0734 |
| Qwen2.5-Coder-7B Q4_K_M | 16 | 16 | 696.3 | 168.1 | 4.142 | 196 | 0.0168 |
All values measured. GPU board power only (sysfs power1_average,
PCI bus 0000:43:00.0); excludes CPU, RAM, cooling and datacenter PUE.
Tariff assumed 0.25 EUR/kWh — the only modeled input, and a linear
multiplier on every euro figure.
gateway.py sits in front of any OpenAI-compatible server and does three
things.
Meters real energy. Every response carries the measured cost:
"x_cost": {
  "tokens": 512,
  "concurrency_at_request": 4,
  "tokens_per_joule_measured": 0.946,
  "energy_joules": 541.2,
  "cost_eur": 0.00003758,
  "basis": "GPU board power only; excludes CPU, RAM, cooling, PUE",
  "cost_model_source": "costbench_qwen7b-q4km-v3-closedloop_...json"
}
cost_model_source is the point: every euro traces back to a measurement
file in this repository. And because the cost depends on the concurrency at
the moment of the request, the same request costs 8.7× less when it arrives
while the GPU is already busy. That is the only honest way to meter on-prem
inference.
Enforces privacy routing. X-Privacy: strict is a constraint, not a
preference: local regardless of queue depth, latency budget, or configured
providers.
Writes a local audit log. SQLite, on-prem, one row per request with
route, reason, tokens, joules, euros and egress. The air-gap claim is not
prose — it is proofs/audit_export_*.json, where
external_egress is 0 across every session.
agent.py — tool invocation, multi-step planning, filesystem confined to a
sandbox root. Actions are constrained by JSON schema, which llama.cpp
compiles to a GBNF grammar, so the model cannot emit a malformed action:
the format is imposed at sampling, not requested in the prompt. That is what
makes a small, fast, fully local model usable as an agent.
A recorded run (proofs/video_take_20260730T112143Z.txt):
[step 1] 37 tok · 77.1 J · €0.00000535 · route=local egress=none
  tool: list_files(proofs/, *.txt)
[step 2] 59 tok · 122.9 J · €0.00000854 · route=local egress=none
  tool: read_file(proofs/bench14b_...txt)
[step 3] 98 tok · 204.2 J · €0.00001418 · route=local egress=none
  final answer

"The best tokens-per-joule ratio is achieved with concurrency 16 ...
 411.65 tok/s at 184.66 W, 0.0312 EUR/1M tok."

3 steps · 194 tokens · 404.2 J · EUR 0.000028 · 0 bytes left the network
Escaping the sandbox is denied, not discouraged: ../ and absolute paths
raise before any read. Repeated identical tool calls are detected and
reported back to the model instead of silently consuming the step budget.
The audit ledger answers "what happened". The dashboard answers the question an operator actually has: what is this costing, who is spending it, and how much capacity am I wasting?

Served at /dashboard, rendered from the same SQLite ledger, with no
external dependencies — a chart pulled from a CDN would not be on-prem.
Three things it surfaces that the raw log does not:
Effective efficiency against the measured ceiling. The headline tokens-per-joule figure is annotated with how far it sits from the 4.14 measured at concurrency 16. Traffic served one request at a time shows up immediately as a fraction of what the card can do.
Where the joules went. Energy grouped by the concurrency at which it was spent, red below 2, gold at 4, teal from 8 up — and a line stating what the same token count would have cost served entirely at concurrency 16. That difference is the headroom, in joules and in euros.
Whether the air gap held. The external-egress counter reads
air-gap intact only when it is genuinely zero. One externally routed
request and the badge disappears and the number turns red.
An agent without memory starts from zero every time: it re-runs list_files,
re-reads the same files, re-spends the same tokens. Every re-spent token is
re-spent energy — and on this hardware we know how much, because we measured
it.
So the memory layer here is not a convenience feature. Its benefit is measurable in joules.
Three tasks over the same measurement files, run twice — once with the memory cleared, once with the memory left by the first round:
| cold | warm | delta | |
|---|---|---|---|
| steps | 6 | 4 | −2 |
| tokens | 305 | 218 | −28.5% |
| joules | 73.6 | 52.6 | −21.0 J |
| cost | €0.0000051 | €0.0000037 | −€0.0000015 |
Raw data in proofs/memory_ab_20260803T024708Z.json.
What the number does and does not mean. Two of the three tasks were
answered correctly in both rounds, citing real values from real files
(411.65 tok/s at concurrency 16, 184.66 W). The third failed in both
rounds, so the comparison is like-for-like — but it is a comparison over
three short tasks, not a benchmark. The saving comes from not re-deriving
facts already established, so it grows with task length and shrinks to zero
on genuinely novel questions.
The joules are derived, not directly measured. An agent task lasts a few seconds — far below the power sensor's ~18 second averaging window, which is exactly the trap documented below. Tokens are converted to joules using the measured curve (4.142 tok/J at concurrency 16), the same curve the gateway uses to price requests.
An earlier version of this experiment reported 69% and was thrown away: the
agent had not answered the question in either round, so it had only learned
to fail faster. It is in rejected/ with the three tool defects
that caused it.
Four things had to be fixed before the numbers meant anything. Each failure produced plausible-looking data, which is why they are documented rather than quietly corrected.
The power sensor lags ~18 seconds. power1_average is a long-window
moving average. Runs of 2–5 seconds finished before the sensor reacted and
reported 14 W under full load. Fix: sustained 90-second runs, first 25
seconds of samples discarded.
The host has 8 GPUs; sysfs exposes all of them. Taking the first readable
hwmon path meant measuring somebody else's card. Fix: resolve the assigned
GPU by PCI bus via rocm-smi --showbus, then read only that card's hwmon.
The resolved bus and paths are recorded in every result file.
Wave-barrier load generation deflates power at high batch. Firing N
requests and waiting for all of them leaves the GPU partly idle during the
straggler tail, and the tail grows with N. Fix: closed-loop load keeping
exactly N requests in flight, with achieved_concurrency measured and
recorded as a validity check.
A stale server on the port makes you measure the wrong model. A liveness
check answered by a leftover process caused a "14B" benchmark that actually
re-measured the 7B — caught because throughput matched the 7B to one decimal
place. Fix: free the port, then verify the served model name, not just that
something answers. See rejected/README.md.
- Board power only. Real operating cost is higher: CPU, RAM, cooling, datacenter PUE and hardware amortisation are excluded.
- The cause of the power drop is hypothesised, not proven. Memory-bound
decode is consistent with the 0.53× cross-model ratio, but clock probing
could not confirm it:
mclksits pinned at 1124 MHz at every concurrency level, so clocks carry no information about memory traffic. Raw data inproofs/clockprobe_*.csv. Settling this needs bandwidth counters. - Token counting approximates one streaming chunk as one token.
- Three concurrency levels (1, 4, 16), single GPU, single quantisation.
- The electricity tariff is assumed, not measured.
git clone https://github.com/Artkill24/costbench && cd costbench

bash setup.sh          # builds llama.cpp with HIP, fetches the model, measures
bash demo.sh           # gateway + agent + audit export
python3 charts.py --proofs proofs/ --out charts/
Requirements. AMD GPU with ROCm 6+ and readable power1_average
telemetry; Python 3.12; cmake, build-essential, git.
Python packages: fastapi, uvicorn, httpx (gateway), huggingface_hub
(model download), matplotlib (figures). costbench.py and agent.py use
only the standard library, deliberately — the measurement path has no
third-party surface.
setup.sh aborts within two minutes if power telemetry is unavailable,
rather than burning a GPU hour to produce nothing.
Environment captured in every result file: driver 6.16.13, ROCm 7.2.1, HIP 7.2.53211, AMD Radeon PRO W7900 (VBIOS 113-D7070910-100, 241 W cap, 51.5 GB), AMD EPYC 9334 host.
agent.py |
sandboxed on-prem agent with per-task energy accounting |
gateway.py |
OpenAI-compatible cost-governance gateway |
memory.py |
persistent agent memory, priced in measured joules |
dashboard.py |
operator view of the audit ledger, served at /dashboard |
costbench.py |
energy-per-token benchmark; PCI-resolved sensor, closed-loop load |
charts.py |
figures and results table from proofs/ |
setup.sh / demo.sh |
unattended GPU sessions |
clockprobe.sh |
clock/power probe (hypothesis test, inconclusive) |
mock_upstream.py |
fake server for wiring tests — produces no measurements |
SPECIFICATION.md |
Track 2 project specification |
proofs/ |
raw results, logs, audit exports, checksums |
rejected/ |
invalidated measurement and post-mortem |
MIT.