chartType sets how the candle area is rendered:
KChartWidget(
  candles,
  ChartColors(),
  timeFrame: const Duration(minutes: 15),
  chartType: ChartType.bars,       // candles, bars, line, area, baseline
  baselinePrice: 42_000,           // baseline only; defaults to the oldest close in view
);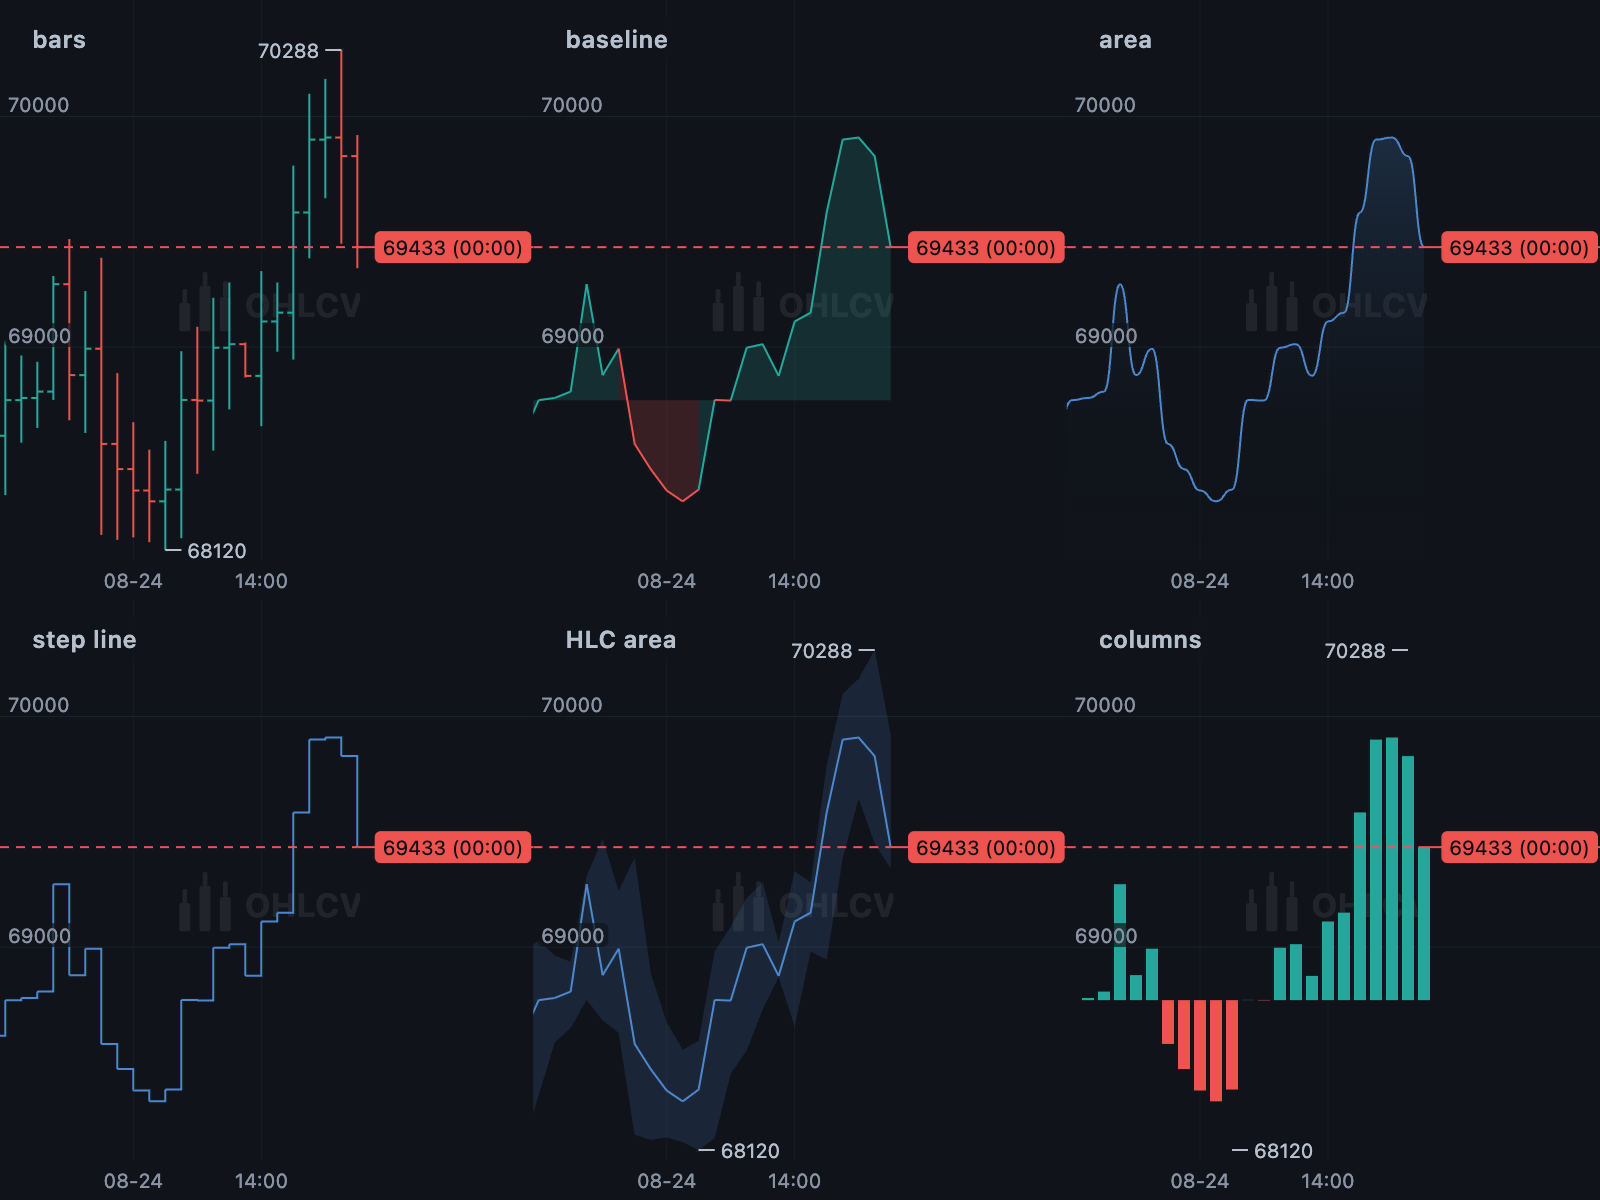
ChartType |
Rendering |
|---|---|
candles |
Filled or hollow body with wicks (default) |
bars |
OHLC bars: high-low range with open tick on the left and close tick on the right |
line |
Line through closing prices |
area |
Line with a filled area below |
baseline |
Line filled towards a baseline, in the up colour above and the down colour below |
stepLine |
Line that holds each close until the next |
hlcArea |
Filled high-low range with the close drawn through it |
columns |
One column per candle, from the baseline to the close |
For backward compatibility, isLine: true is equivalent to ChartType.area.
Heikin-Ashi, Renko, three-line break, Kagi, point & figure and range bars change
the candle data itself rather than how it is drawn, so they are provided as
transforms. Pass the candles through CandleTransforms, then compute
indicators on the result:
final ha = CandleTransforms.heikinAshi(candles);
DataUtil.calculate(ha);

final bricks = CandleTransforms.renko(
  candles,
  brickSize: CandleTransforms.atrBrickSize(candles) ?? 25,
);
DataUtil.calculate(bricks);

KChartWidget(ha, ChartColors(), /* … */);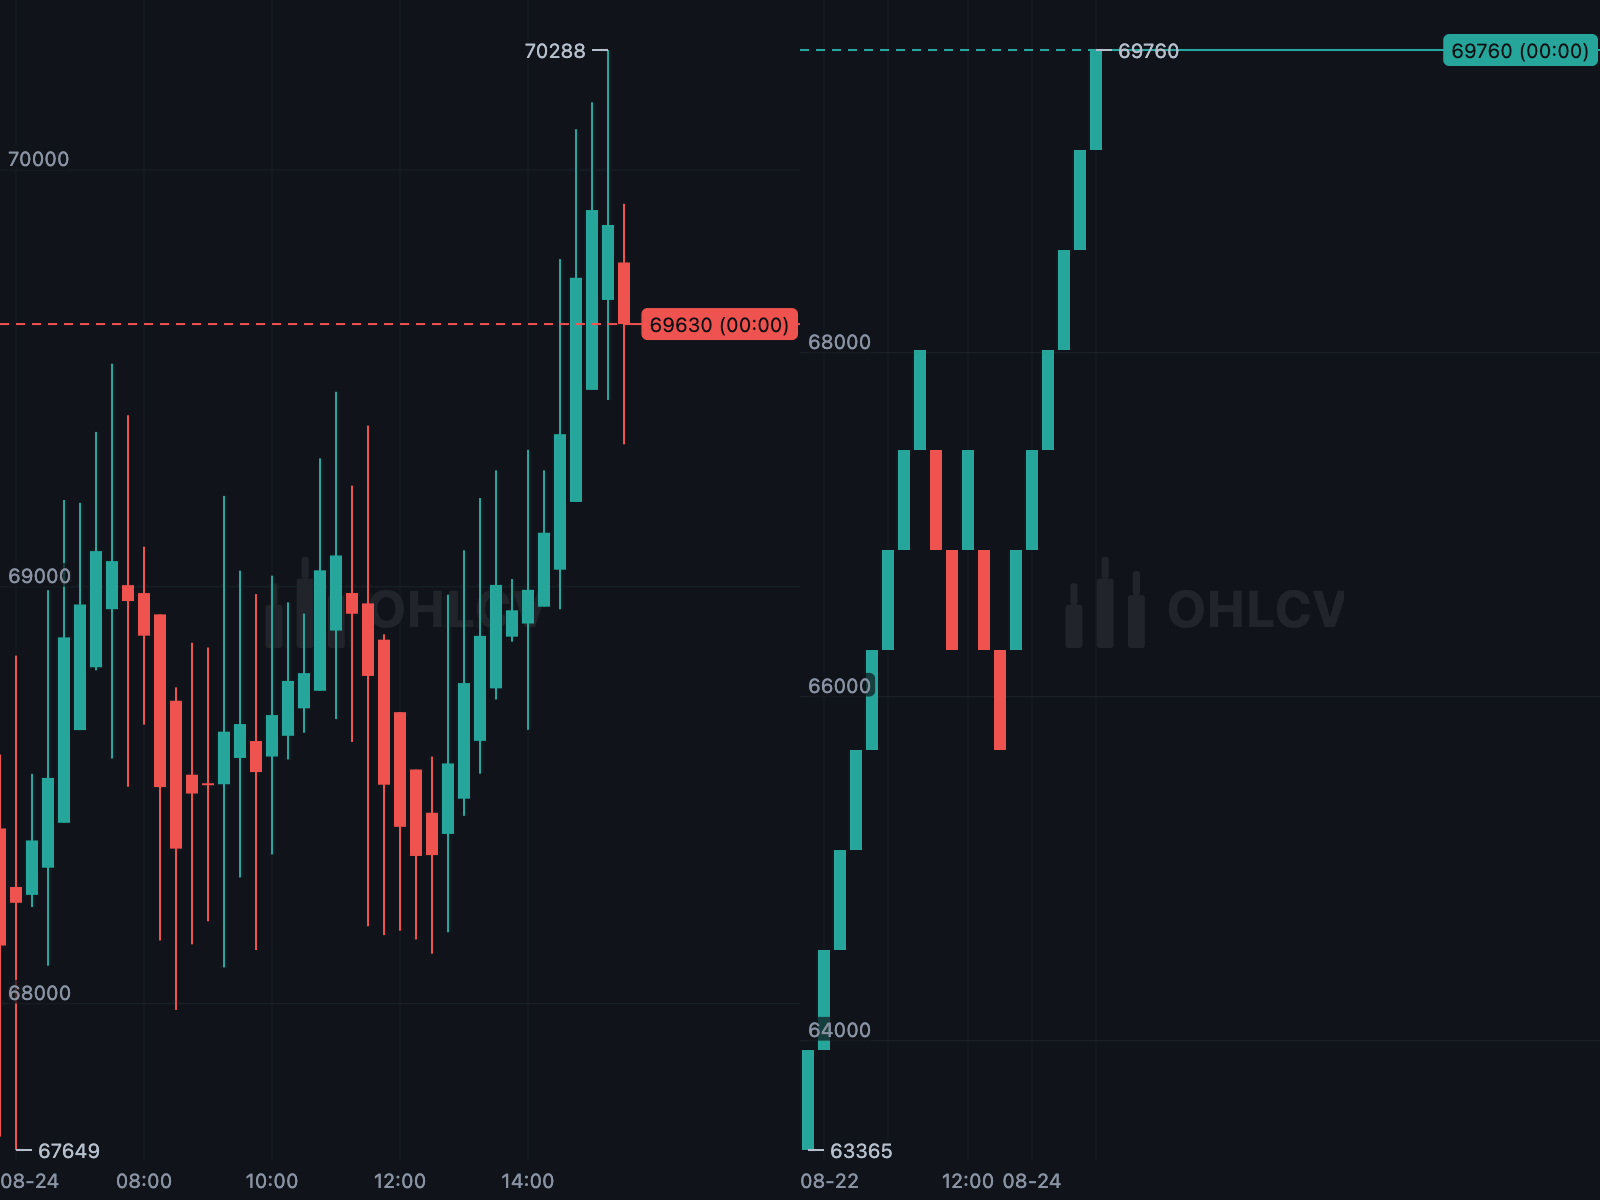
Heikin-Ashi produces one candle per source candle at the same timestamps, so drawings stay in place. The other transforms are price-based and not time-based; each output bar carries the combined volume of the candles it covers.
| Transform | New bar condition |
|---|---|
renko(brickSize:) |
Close moves one full brick beyond the previous brick; reversals require two |
lineBreak(lines: 3) |
Close beyond the previous block; reversals must exceed the extreme of the last lines blocks |
kagi(reversal:, asPercent:) |
Price retraces by reversal from the extreme; each segment represents a full trend |
pointAndFigure(boxSize:, reversalBoxes: 3) |
Price moves a full box, based on highs and lows; a new column requires reversalBoxes boxes |
rangeBars(range:) |
Price moves range from the bar's open |
atrBrickSize derives a brick, box, reversal or range size from the average true
range:
final step = CandleTransforms.atrBrickSize(candles) ?? candles.last.close * 0.005;

final blocks = CandleTransforms.lineBreak(candles);
final segments = CandleTransforms.kagi(candles, reversal: step);
final columns = CandleTransforms.pointAndFigure(candles, boxSize: step);
final bars = CandleTransforms.rangeBars(candles, range: step);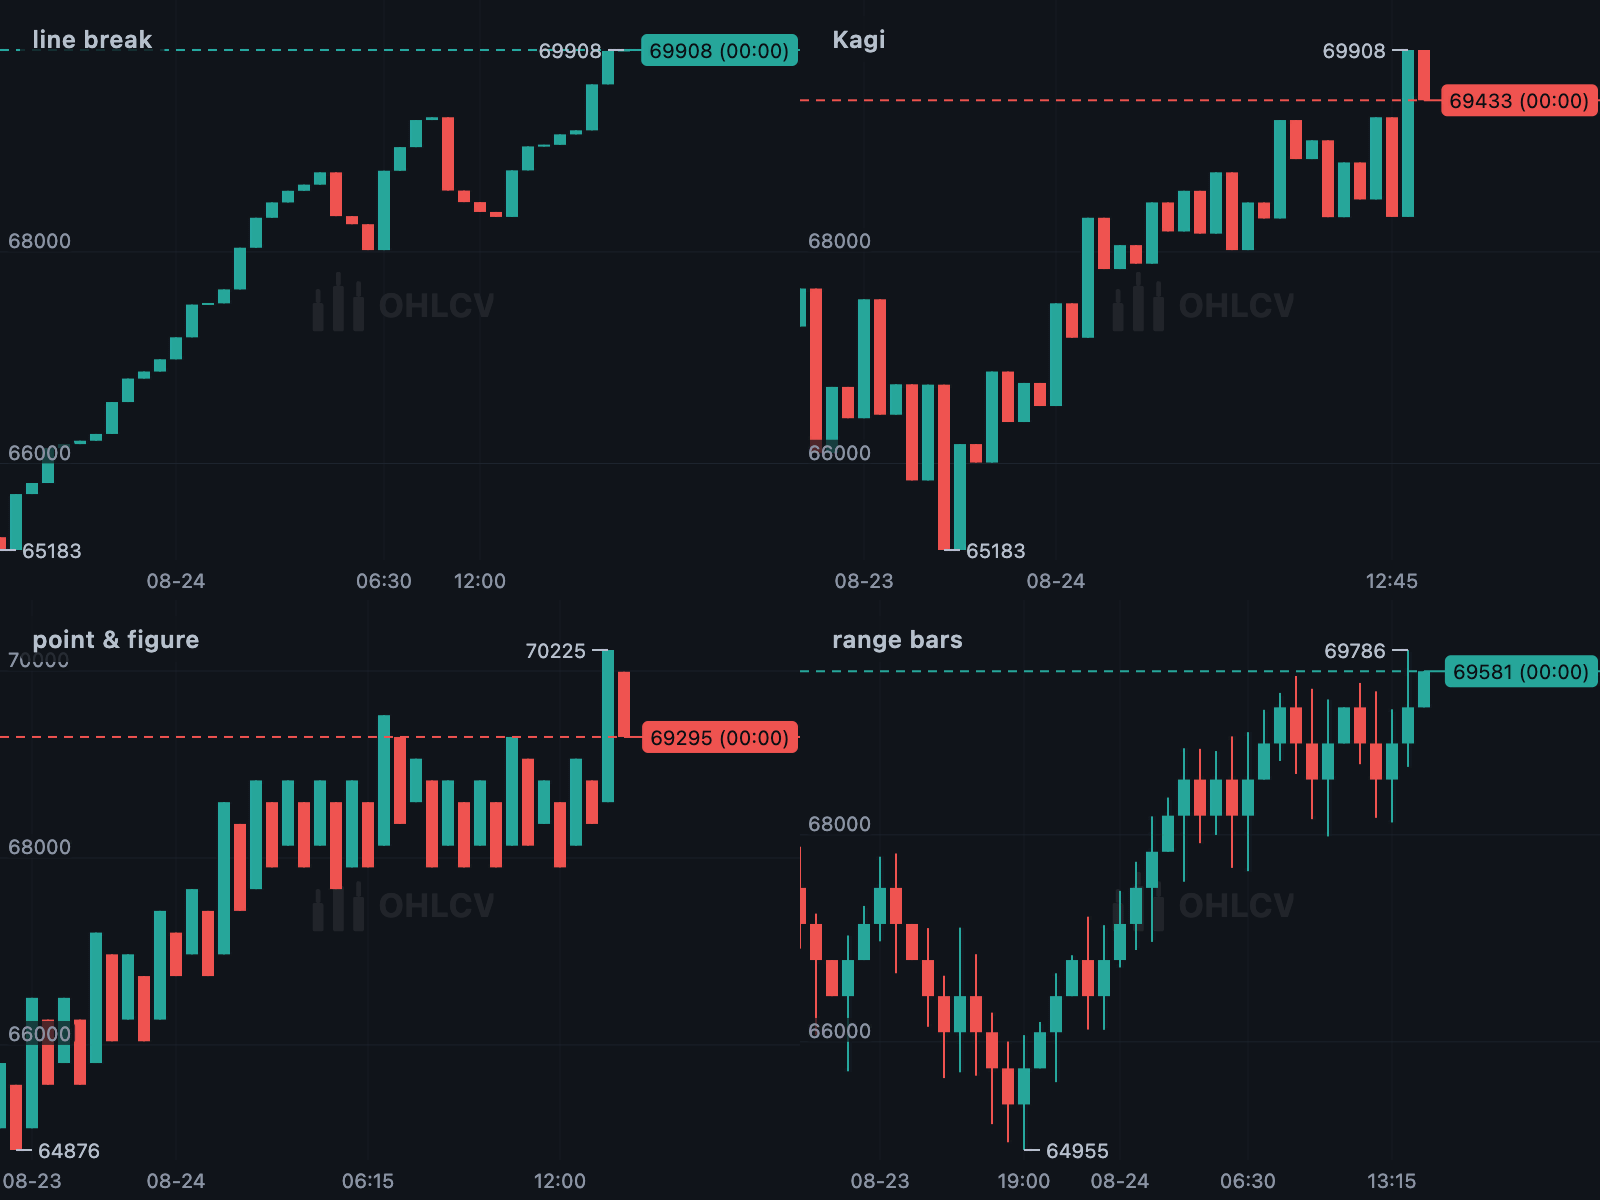
All transforms return standard candles with their own timestamps, so the chart,
indicators and drawing tools work without changes. Note that bar meaning
differs by transform: a Kagi segment is a complete trend, a point & figure
candle is a column of boxes, and a range bar covers exactly range.